2013 Interim Results Presentation
advertisement
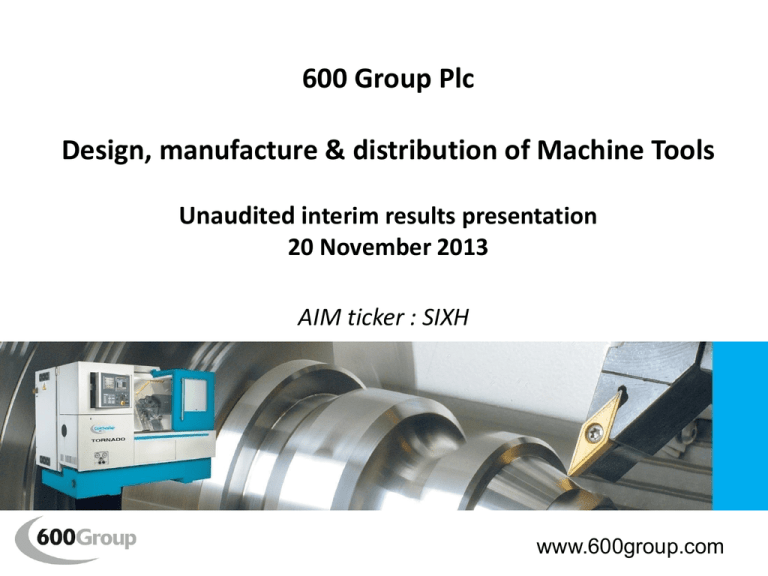
600 Group Plc Design, manufacture & distribution of Machine Tools Unaudited interim results presentation 20 November 2013 AIM ticker : SIXH www.600group.com Presentation contents Unaudited interim results for the six months ended 28 September 2013 Highlights Financial review Risk analysis Outlook 2 Highlights • Revenues up against industry trend • Gross & operating margins continue to increase • Cash conversion of 108% from trading activities • Pension fund – 31 March 2013 valuation signed off • Site compression project at Heckmondwike completed • Electrox – workstation range launched successfully • Market conditions forecast to improve in coming months* *Source – Oxford Economics, Global Machine Tool Outlook Survey - Autumn 2013 3 Global reach – Group sales by destination FY 13 audited, % of total UK Continental Europe RoW North America 15% 15% 55% 15% 4 Machine tools – industry growth statistics World Machine Tools output (in $bn) 120.0 103.5 94.3 100.0 95.4 82.5 82.8 80.0 60.0 93.2 89.9 95.4 86.8 68.8 56.0 40.0 20.0 0.0 2008a 2009a 2010a 2011a 2012a 2013f 2014f 2015f 2016f Spring 2013 Autumn 2013 Source – Gardner Research, World machine Tool Output & Consumption Surveys 2013 5 Machine tools – industry growth statistics Forecast growth % in consumption - 2013 vs 2012 Spring 2013 Autumn 2013 3.9% 4.0% 2.4% 0.5% 2.0% 0.0% -2.0% Asia Americas Europe World -1.4% -4.0% -3.8% -3.0% -6.0% -8.0% -8.2% -10.0% -12.0% -11.0% Source – Oxford Economics, Global Machine Tool Outlook Surveys 2013 6 Financial highlights • Group revenues up 5.2% to £20.94m (FY13 H1: £19.91m) • Adjusted net profit before tax* of £0.58m (FY13 H1: loss of £0.33m) • Total profit attributable of £0.80m (FY13 H1: loss of £0.73m) • Earnings of 0.95p (FY13 H1: loss of 0.35p) • Net debt of £5.60m (31 March 2013: £5.41m) • NAV (excluding net pension effect) of 11.6p per share *from continuing operations, before pension fund credit interest & amortisation of shareholder loan costs (and special items in prior year only ) 7 Revenue development • North America - revenues down 7% on FY13 H1 • • • • • UK/Europe – revenues up >35% on FY13 H1 • • • • • Market conditions dipped FY13 Q4 Tough FY14 Q1 (down 14% y-o-y) Flat FY14 Q2 y-o-y Positive book-to-bill Supply chain/lead times fully regularised UK market conditions show good improvement Eurozone remains sluggish but further share to regain Book-to-bill not yet back to positive RoW – revenues down 6% on FY13 H1 • Growth in ME/Africa but Australia sharply down 8 Financial review CONSOLIDATED INCOME STATEMENT £M REVENUE* FY14 H1 FY13 H1* FY13* 20.94 19.91 41.79 (14.02) (13.70) (29.14) 6.92 6.21 12.65 (6.15) (6.61) (10.98) 0.77 (0.40) 1.67 (0.19) (0.51) (0.46) ADJUSTED PBT* 0.58 (0.91) 1.21 NET FINANCIAL INCOME / (EXPENSE) Net pension credit & IFRS adjustment 0.36 0.25 0.50 NET PROFIT BEFORE TAX* 0.94 (0.66) 1.71 (0.14) 0.43 0.65 - (0.50) (0.30) 0.80 (0.73) 2.06 COST OF SALES* GROSS PROFIT* NET OPERATING EXPENSES* NET PROFIT/(LOSS) FROM OPERATIONS* NET FINANCIAL INCOME / (EXPENSE) Bank and other debt TAXATION CREDIT/CHARGE* DISCONTINUED ACTIVITIES NET PROFIT / (LOSS) FOR THE PERIOD *Prior year figures from continuing activities only, and now restated for revisions to treatment of pensions interest under IAS 19 9 Financial Review SEGMENTAL REPORTING FY 14 H1 FY 13 H1 FY 13 MACHINE TOOLS LASER MARKING INTERSEGMENTAL 17.65 3.46 (0.17) 16.50 3.49 (0.08) 34.91 7.01 (0.13) TOTAL REVENUE* 20.94 19.91 41.79 1.21 0.15 (0.59) 0.45 0.11 (0.63) 2.15 0.21 (1.39) 0.77 (0.07) 0.97 6.9% 4.3% 3.7% 2.7% 3.2% -0.4% 6.2% 3.0% 2.3% £M REVENUE* OPERATING PROFIT / (LOSS)* MACHINE TOOLS LASER MARKING HEAD OFFICE/UNALLOCATED TOTAL OPERATING PROFIT/(LOSS)* OPERATING MARGIN* MACHINE TOOLS LASER MARKING GROUP *denotes from continuing activities before special items in prior year 10 Financial review STATEMENT OF FINANCIAL POSITION Sept 13 Mar 13 5.83 5.80 12.09 11.73 9.19 5.79 (6.14) 8.84 10.27 6.18 (6.97) 9.48 1.25 (4.63) (2.22) (5.60) 1.02 (4.26) (2.16) (5.40) 0.69 0.04 NET ASSETS 21.85 21.65 NAV per share NAV per share (excl. pensions) 25.9p 11.6p 24.4p 10.5p £M FIXED ASSETS NET PENSION SURPLUS Net of associated deferred taxation WORKING CAPITAL Inventory Receivables Payables NET DEBT Cash & cash equivalents Bank and financial leases Shareholder loans OTHER ASSETS/(LIABILITIES) (NET) 11 Financial review CASH FLOW STATEMENT FY14 H1 FY13 H1 FY13 PROFIT FOR PERIOD 0.80 (0.73) 2.06 ADJUSTMENT FOR NON CASH ITEMS 0.27 (0.01) (0.96) (0.24) (1.80) (3.00) 0.83 (2.54) (1.90) (0.48) (0.39) (0.51) 0.35 (2.93) (2.41) (0.50) 2.72 3.48 EQUITY RAISED 0.03 1.42 1.42 DEBT DRAWN/(REPAID) 0.42 (0.20) (1.39) NET CASH FLOW 0.30 1.01 1.10 DEBT FINANCING (0.42) 0.19 1.52 FX MOVEMENTS (0.07) (0.09) (0.03) MOVEMENT IN NET DEBT (0.19) 1.11 2.59 £M WORKING CAPITAL AND OTHER ITEMS TRADING CASH FLOW INTEREST AND TAXATION PAID OPERATING CASH FLOW INVESTING ACTITIVIES 12 Business & financial risk evaluation Risk Mitigating factors • Cyclical nature of capital goods markets • Market niche position – not high ticket • Premium margins on components and aftermarket • Geographic dispersion • Reliance on supply chain partners • Strategic approach • Product diversification • Economic/political uncertainty • Geographic dispersion • Co-operation of key partners • Availability of credit • Shareholder support • Good banking relationships • Monitoring of working capital needs • Foreign currency exchange • Natural hedge of US$ revenues • No long term fixed price contracts • Large pension fund • Currently well funded • Investment portfolio hedged • Plan to proceed to buy-out 13 UK pension scheme Accounting surplus (£m) FY14 H1 FY13 192.90 203.30 (173.07) (183.84) Net surplus under IFRS 19.83 19.46 Deferred tax provision (6.94) (6.81) Net asset recognised 12.89 12.65 Scheme assets Scheme liabilities • • • • • • Accounting surplus based on IFRS “best estimate” assumptions of future outcome 31 March 2013 funding valuation signed off with Trustee in October 2013 Prepared using more prudent assumptions as required by regulations Technical Provisions deficit of £19.5m at 30 September 2013 on this basis Agreed Recovery Plan based on investment performance at 1% above gilts No cash contributions required until next valuation (subject to further review) 14 Heckmondwike – compression project Heckmondwike Site = 225,000 ft2 down to 75,000 ft2 20,000 ft2 60,000 ft2 130,000 ft2 15,000 ft2 15 Heckmondwike – compression project Right – vacated factory space Above/below: Machine shop and assembly areas Montage: refurbished office space and showroom 16 Electrox LaserIntroduction – New Product Launches New Product Objectives • Improved performance, functionality and flexibility • Unified aesthetics to create product “family” • Reduced unit cost, build time & inventory holding Market tested with distributors in April 2013 Launched at EMO Hanover in September 2013 17 Electrox Laser – new product example EMS200 is the replacement for the MAXBOX • Reduced material content • Reduced build time • Improved ergonomic design, offering improved working area and fully integrated laser 18 Machine tools – industry growth statistics Forecast growth % in consumption - 2014 vs 2013 7.3% 8.0% 7.0% 6.0% 4.7% 4.8% 5.2% 5.0% 4.0% 3.0% 2.0% 1.0% 0.0% Asia Americas Europe World Source – Oxford Economics, Global Machine Tool Outlook Survey Autumn 2013 19 Outlook • • • • Business confidence returning in most markets Renewed interest in manufacturing in US/Europe Leading global brands, unrivalled heritage Priorities: – Product development – Continuous improvement – Customer satisfaction 20 Disclaimer The information contained in this presentation (“Presentation”) has been prepared by 600 Group plc (the “Company”) and is being communicated for general background informational purposes only. The Presentation has not been independently verified and the information contained within is subject to updating, completion, revision, verification and further amendment. While the information contained herein has been prepared in good faith, neither the Company, nor its shareholders, directors, officers, agents, employees, or advisors give, has given or has authority to give, any representations or warranties (express or implied) as to, or in relation to, the accuracy, reliability or completeness of the information in this Presentation, or any revision thereof, or of any other written or oral information made or to be made available to any interested party or its advisers (all such information being referred to as “Information”) and liability therefore is expressly disclaimed. Accordingly, neither the Company nor any of its shareholders, directors, officers, agents, employees or advisers take any responsibility for, or will accept any liability whether direct or indirect, express or implied, contractual, tortuous, statutory or otherwise, in respect of the accuracy or completeness of the Information or for any of the opinions contained herein or for any errors, omissions or misstatements or for any loss, howsoever arising from this Presentation. In communicating this Presentation, the Company does not undertake or agree to any obligation to provide the recipient with access to any additional information or to update this Presentation or to correct any inaccuracies in, or omissions from, this Presentation which may become apparent. Information contained in this Presentation is the property of the Company. It is made available strictly for the purposes referred to above. The Presentation and any further information made available to any recipient may not be reproduced, used or disclosed without the prior written consent of the Company. This Presentation is confidential and shall not be copied, published, reproduced, or distributed in whole or in part at any time without the prior written consent of the Company. This Presentation should not be considered as the giving of investment advice by the Company or any of its shareholders, directors, officers, agents, employees or advisers. Each party to whom this Presentation is made available must make its own independent assessment of the Company after making such investigations and taking such advice as may be deemed necessary. In particular, any estimates or projections or opinions contained herein necessarily involve significant elements of subjective judgment, analysis and assumption and each recipient should satisfy itself in relation to such matters. Neither the communication of this Presentation nor any part of its contents is to be taken as any form of commitment on the part of the Company to proceed with any transaction. In no circumstances will the Company be responsible for any costs, losses or expenses incurred in connection with any appraisal or investigation of the Company. This Presentation does not constitute, or form part of, any offer or invitation to sell or issue, or any solicitation of any offer to subscribe for or purchase any securities in the Company, nor shall it, or the fact of its communication, form the basis of, or be relied upon in connection with, or act as any inducement to enter into, any contract or commitment whatsoever with respect to such securities. Disclaimer The communication of this Presentation in or to persons in certain jurisdictions may be restricted by law and persons who may receive communication of this Presentation should inform themselves about, and observe any such restrictions in advance of communication to them of this Presentation. Any failure to comply with these restrictions may constitute a violation of the laws of the relevant jurisdiction. In particular, this Presentation has not been approved by an authorised person pursuant to Section 21 of the Financial Services and Markets Act 2000 (“FSMA”) and accordingly it is being delivered in the United Kingdom only to persons to whom this Presentation may be delivered without contravening the financial promotion prohibition in Section 21 of the FSMA. Those persons are described in the Financial Services and Markets Act 2000 (Financial Promotion) Order 2005 (“Order”) and include persons who have professional experience in matters relating to investments and who fall within the category of person set out in Article 19 (investment professionals) of the Order and high net worth entities as defined in Article 49(2) of the Order. Any activity to which this Presentation relates in the United Kingdom is available to, and will only be engaged with such persons and this Presentation should not be acted or relied upon in the United Kingdom by persons of any other description. This Presentation has not been approved as a prospectus by the United Kingdom Listing Authority (“UKLA”) under Section 87A of FSMA and has not been filed with the UKLA pursuant to the United Kingdom Prospectus Rules. This Presentation nor any copy of it may be taken or transmitted into the United States of America or its territories or its possessions (the “US”) or distributed directly or indirectly into the US or to any US person as defined in Regulation S under the Securities Act 1933 as amended, including US resident corporations or other entities organised under the laws of the US or any state thereof or non-US branches or agencies of such corporations or entities. Nor shall this Presentation be taken, transmitted or distributed into Australia, Canada, Japan, Singapore, South Africa, or any other jurisdiction which prohibits the same except in compliance with applicable securities laws. The Presentation is not an offer of securities for sale in the US. Securities may not be offered or sold in the U S absent registration under the US Securities Act or an exemption there from. The Company has not registered and does not intend to register any shares or securities under the US Securities Act. By accepting communication of this Presentation, the recipient represents and warrants that it is a person to whom this Presentation may be communicated without a violation of the laws of any relevant jurisdiction. This Presentation is not to be communicated to any other person or used for any other purpose and any other person who receives communication of this Presentation should not rely or act upon it. finnCap Limited, which is authorised and regulated in the United Kingdom by the Financial Conduct Authority, are acting exclusively for the Company and no-one else in connection with the matters described in this Presentation and will not be responsible to anyone other than the Company for providing the protections afforded to clients of finnCap Limited.


