The SWOT Matrix - Official Website of the Division of City Schools
advertisement
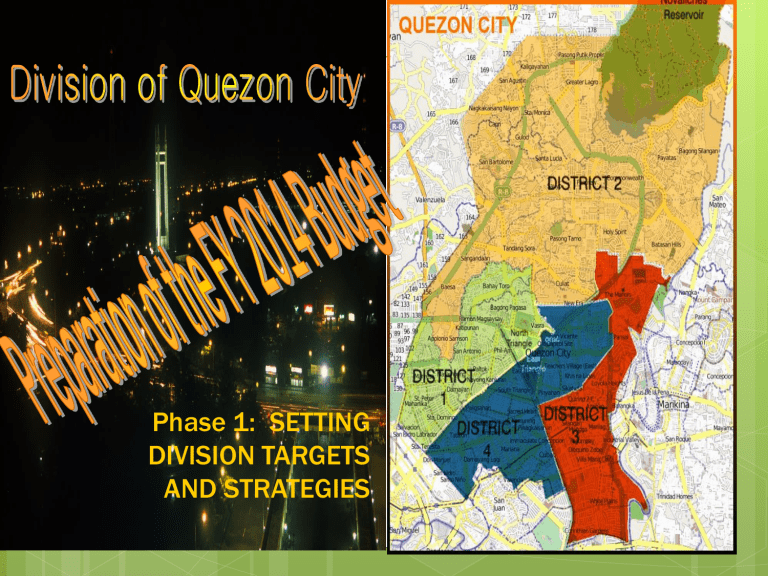
Phase 1: SETTING DIVISION TARGETS AND STRATEGIES VISION: “Globally competitive, morally upright and fully committed learners.” MISSION: “The Division of City Schools is committed to provide learners access to excellent basic education and life-long learning through technologically-driven, value-laden and fully engaged instruction.” GOALS AND OBJECTIVES: Goal 1. Increased Access to Basic Education (PROVISION OF ACCESS) General Objectives: Improved enrolment participation rates in all levels of basic education systems Improved program resources and the corresponding program/project indicators Goal 2. Improved learners performance (QUALITY AND RELEVANCE OF BASIC EDUCATION) General Objective: Improved performance in the National Achievement Test Goal 3. Improved Internal Efficiency (MANAGEMENT OF EDUCATIONAL SERVICES General Objectives: Improved Cohort Survival Rate and Completion Rate in all levels Decreased Dropout / Leaver Rate in all levels. DIVISION CORE VALUES: I-CARES Integrity Creativity Accountability Responsibility Excellence Strategic Partnership BASIC INPUTS-PUBLIC SCHOOLS No. of Schools Classes Enrolment Teacher Items /Mobile Pupil/Student :Teacher Ratio Classrooms Pupil/Student: Classroom Ratio (1 shift) Seats (1 shift) Pupil/Student: Furniture Ratio (1 shift) Prep Elementary Secondary (96) 96 46 1080 5109 2806 26,712 261,616 151,856 382 6,115 4,529 34.96 42.78 33.53 201 3139 1973 132.90 83.34 76.97 151,792 92,060 1.72 1.65 Total 142 8,995 440,184 11,026 39.92 5,313 82.85 243,852 1.81 EXTERNAL ANALYSIS MATRIX AREA DATA (Source: Online) Economic QC is gaining place in the global arena with WB citing QC as one of the richest and cleanest city in the Philippines Large consumer market of 2.9 million people (24% of NCR population) One of the largest sources of manpower in the Philippines Employable human resource = 1.67 million Young labor force of almost 1 million OPPORTUNITIES THREATS •QC is an ideal place to Incidence of put up any legitimate poverty is high kind of business and livelihood Resources of schools are depleted Large employable Population: Ages 20-64 = 1.672 M Ages 31-40 = 1.0868 M Ages 30 below = 0.617M Negative effect on Access, quality and Efficiency of the schools EXTERNAL ANALYSIS MATRIX AREA Economic DATA (Source: Online) Land area = 16,112 hectares (25% of the land area of Metro Manila) Large tracts of land available for development CD I,III & IV) Reasonably priced real estate values Ideal transshipment point between north and south •3,631 Php. Per capita home of the country’s best schools and universities OPPORTUNITIES THREATS •QC is an ideal place to put up any legitimate kind of business and livelihood Incidence of poverty is high Resources of schools are depleted •One of the most Negative effect on strategic and most Access, quality and cost-effective Efficiency of the schools locations for business in the Philippines •Families are sources of enrolling children in schools EXTERNAL ANALYSIS MATRIX AREA Social DATA (Source: Online) OPPORTUNITIES Large dependent population 1/3 (33%) of population is less than 15 years old. 34.38% or 997,000 people are youthful people More than 40% of the population is younger than 20 yrs Average age is 24 year20,000 college graduates produced yearly Literacy Rate = 98.32% slightly higher than the NCR THREATS •Families are sources of enrolling children in schools EXTERNAL ANALYSIS MATRIX AREA Social DATA (Source: Online) OPPORTUNITIES Large dependent population 239,605 families are informal settlers Densely populated but unevenly distributed; most populated is CD II THREATS •Families are sources of enrolling children in schools 12.1% of children of ages 5-14 population is working Poverty incidence of 3.8 % (NSCB 2009) or 19,397 Families as estimated from the total population of 2,960,627 Child labor due to poverty EXTERNAL ANALYSIS MATRIX AREA Political DATA (Source: Online) 4 Congressional Districts 6 Councilors & 1 Congressman each 142 barangays Presence of Ordinances to support education Institutionalization of the CDP for QC (Master plan) ECCD support (daycare centers) Good housekeeping of the City Business-Friendly City City-government initiated Lowcost housing project OPPORTUNITIES THREATS Strong political support from the LSB for quality basic education Strong private-public industry partnerships More business networking Teachers as beneficiaries of city housing projects High population density in CD II EXTERNAL ANALYSIS MATRIX AREA Ecological- DATA (Source: Online) • with many large parks integrated in mixed-use communities • with expansive lands available for large-scale development with major parks which include La mesa Reserve /Eco Park, Ninoy Aquino Parks & Wildlife, QC memorial Circle. Balara Filters Park, UP Arboretum OPPORTUNITIES Ideal for high rise “green” buildings THREATS Its large population produce tons upon tons of solid wastes daily, posing threat to the environment Vulnerable to floods, earthquakes EXTERNAL ANALYSIS MATRIX AREA Technological DATA (Source: Online) • More than 60 business process outsourcing companies • All leading telecom providers • Top ICT schools in the country • More than 450 computer retailers and distributors OPPORTUNITIES Highest concentration of ICT zones in the country which provide educational and employment opportunities Provide improved educational • 6 major television stations competencies • Close to 600 internet cafes •Entertainment center of the country •28 registered ICT Parks with PEZA THREATS Lower school efficiency unregulated use of ICT (cyber crimes involving students and school-age children) INTERNAL ANALYSIS MATRIX AREA: Basic Inputs Enrolment Teachers DATA Enr (Prep) = 26,712 Enr (Elem) = 261,616 Enr (Sec) = 151,856 Total nr = 440,184 Prep = 369 Elem = 6,115; PTR= 42.78 Sec = 4,529; STR = 33.53 ALS = 13 Total = 11,026 STR = 39.92 Classrooms STRENGTHS Existence of physical and human resources WEAKNESSESS 22 schools are congested Strong political support from local and national Disproportionate elected officials for distribution of teachers additional teacher in 4 CD’s items Trained and competent teachers on Policy governance e-Kasi QC, FUSE Good QC teachers become curriculum writers/ speakers, etc. CD I,III & IV, 1 shift; Prep = 201 Elem = 2,950 PCR = 83.34 (41) National and local Sec = 1,649 STR = 76.97 (38) gov’t partnership in the TOTAL = 4,800 STR= 82.85 (42) construction of additional classrooms Disparity in availability of classrooms; (inavailability in CD II) No buildable for some congested schools INTERNAL ANALYSIS MATRIX AREA: Basic Inputs Seats DATA 243,852 Textbooks WatSan Facilities STRENGTHS WEAKNESSESS 1:1 seat:pupil ratio Preventive maintenance not in place 1:1 textbook:pupil ratio Toilet bowls ES&Prep: ForGirls = 1139+336 shared = 1475 Girls-TBowl Ratio = 95:1 For Boys = 886 +218 indiv +218*3 urin troughs=1758 Boys-TBowl Ratio = 85:1 No water supply or not adequate in some schools (Sauyo ES, etc.) At the close of 2012, 240 and 111 toilet bowls had been added Preventive Maintenance constructions in 54 and repair not in place elementary Toilet bowls HS: schools and 23 For Girls =544+44 shared secondary Not enough toilet bowls Girl-TBowl Ratio = 130:1 schools, especially for girls For boys = 438+ 145 indiv. respectively +95*3 urinal troughs Boys-TBowl Ratio = 89:1 INTERNAL ANALYSIS MATRIX AREA: Performance Indicators* Access Indicators DATA AIR = 116.32 NER = 60.50 GER (ES) = 100.93 GER (HS) = 96.79 NER (ES) = 87.72 NER (HS) = 74.69 STRENGTHS WEAKNESSESS High enrolment Physical, and financial participation of school- resources stretched to going age population the limit High absorptive capacity of schools 16.32% of enrollees in Kinder & Grade 1 are over-aged ; 0.93% in the elementary are over-aged. Weak instructional supervision NAT (GR 3) = 46.96 Availability of NAT (GR 6) = 54.26 competent teachers Quality Indicators NAT (Yr 4) = 50.41 More room for improvement No assessment plan Challenge to do better CSR (ES) = 82.01 Institutionalization of High dropout rate CSR (HS) = 83.60 Parents Values Seminar CompR (ES) = 79.10 Institutionalization of Efficiency Indicators CompR (HS) = 79.11 best DORP DOR (ES) = 0.47 practices/DORP DOR (HS) = 5.62 Journal *on Access, Quality, Efficiency, Governance (both public and private schools) INTERNAL ANALYSIS MATRIX AREA: PI DATA EBEIS LIS HRIS Governance e-NGAS STRENGTHS Data driven decisions WEAKNESSESS Technical problems re: connectivity Updated employee records System stability and implementation ICT driven communication issues system for internal efficiency Transparency INTERNAL ANALYSIS MATRIX AREA: Awards and Recognitions Regional National International DATA Sports Regional Palaro Elem –Champion Champion in Regional Journalism STRENGTHS Presence of seasoned and veteran trainers 2 Metrobank TeacherAwardees Journalism -do- Delegate to the 1st Lego League in Australia Arts competition in HongKong Math Olympiad Deutsch (German) Song & Dance Competition3rd place -do- WEAKNESSESS Talents are pirated The SWOT Matrix S-O Strategic Options: Social marketing to enhance publicprivate partnership/enhance stakeholders participation to basic education Provide increase access to different kinds of learners (Curriculum modification to enhance/strengthen Technical-Vocational education, special program for the arts, ESEP and Sports curriculum) Public-private partnership to Intensify teachers’ housing advocacy Capacity building to improve learning outcomes S-T Strategic Options: Strengthen career guidance and counselling Program Intensify disaster and waste management program in school Improve schools level of SBM Practice Improve the capacity of school heads in managing resources Institute programs that will enhance schools efficiency W-O Strategic Options: Improve teacher deployment system to address the problem of disparity Use of technology to improve access (ADM/ALS) Media advocacy to Intensify Information and dissemination campaign for ECE and other special programs Technical Assistance to strengthen Instructional Supervision Institutionalize existing PAP’s in all school to address efficiency Expand Mentoring and coaching program Capacity building to enhance teachers’ competence in special programs Improve teachers’ welfare and well-being Sustain talent pool among teachers W-T Strategic Options: Enhance absorptive capacity of schools Enhance teachers capacity to handle and manage large classes Improve and align existing learning materials to special curricula PERFORMANCE INDICATORS ELEMENTARY Gross/Apparent Intake Rate Net Intake Rate Gross Enrolment Rate Net Enrolment Rate Cohort Survival Rate Completion Rate School Leaver Rate No. of Dropouts 2011 (11-12) 2012 2013 2014 2015 2016 (16-17) Annual Increase to Meet the Target NCR 121.29 117.03 112.78 108.52 104.26 100 -4.26 Total Male Female NCR Total Male Female NCR Total Male Female NCR Total Male Female NCR Total Male Female NCR Total Male Female NCR Total Male Female Total Male Female 116.32 119.27 113.17 62.04 60.05 58.68 61.51 104.25 100.93 99.67 102.26 90.72 87.72 85.6 89.97 86.26 82.01 79.11 84.76 83.06 79.12 78.00 82.56 2.93 3.70 4.85 3.06 1328 813 425 112.06 115.42 110.54 69.63 67.64 66.94 69.21 105.40 102.08 101.74 103.81 92.57 89.58 88.48 91.98 88.61 86.00 82.89 87.41 85.45 81.51 81.40 85.05 2.35 3.00 3.88 2.45 1062 650 340 107.80 111.56 107.90 77.23 75.23 75.21 76.91 106.55 103.23 103.80 105.36 94.43 94.43 91.36 93.98 89.96 88.35 86.67 90.06 87.84 83.90 84.80 87.54 1.76 1.75 2.91 1.84 797 488 255 103.55 107.71 105.27 84.82 84.82 83.47 84.60 107.70 107.70 105.87 106.90 96.29 96.29 94.24 95.99 90.00 90.70 90.44 92.70 90.22 86.28 88.20 90.02 1.17 1.16 1.94 1.22 531 325 170 99.29 103.85 102.63 92.41 92.41 91.74 92.30 108.85 108.85 107.93 108.45 98.14 98.14 97.12 97.99 95.00 95.00 94.22 95.35 92.00 88.67 91.60 92.51 0.59 0.58 0.97 0.61 266 163 85 100 100 100 100 100 100 100 110 110 110 110 100 100 100 100 98 98 98 98 95 95 95 95 0 0 0 0 0 0 0 -3.26 -3.85 -2.63 7.59 7.99 8.26 7.70 1.15 1.81 2.07 1.55 1.86 2.46 2.88 2.01 2.35 3.20 3.78 2.65 2.39 3.18 3.40 2.49 -0.59 -0.74 -0.97 -0.61 -265.60 -162.60 -85.00 PERFORMANCE INDICATORS National TOTAL-NCR Achievement Test Grade 3 Total-QC 2011 (11-12) 2012 2013 2014 2015 2016 (16-17) 45.17 51.14 57.10 63.07 69.03 75 52.67 58.63 64.60 70.56 75.5 NCR-Reading English 46.96 59.13 42.80 49.24 55.68 62.12 68.56 75 QC-Reading English 44.41 50.63 56.85 63.06 69.28 75.5 NCR-Reading Filipino 50.68 55.54 60.41 65.27 70.14 75 QC-Reading Filipino 52.20 56.86 61.52 66.18 70.84 75.5 NCR-English Grammar 42.07 48.66 55.24 61.83 68.41 75 QC-English Grammar 44.66 50.83 57.00 63.16 69.33 75.5 NCR-Filipino Grammar 48.25 53.60 58.95 64.30 69.65 75 QC-Filipino Grammar 49.45 54.66 59.87 65.08 70.29 75.5 NCR-Science 42.44 48.95 55.46 61.98 68.49 75 QC-Science 44.23 50.48 56.74 62.99 69.25 75.5 NCR-Math 43.75 50.00 56.25 62.50 68.75 75 QC-Math 45.98 51.88 57.79 63.69 69.60 75.5 PERFORMANCE INDICATORS National Achievement Test 2011 (11-12) 2012 2013 2014 2015 2016 (1617) Annual Increase to Meet the Target NCR - Total Test 57.08 60.66 64.25 67.83 71.42 75 3.58 QC - Total Test 54.26 58.51 62.76 67.83 72.08 75.5 4.25 58.33 Grade 6 Eng-NCR 56.80 60.44 64.08 67.72 71.36 75 3.64 English-QC 54.95 59.06 63.17 67.72 71.83 75.5 4.11 Math-NCR 51.99 56.59 61.19 65.80 70.40 75 4.60 Math-QC 47.99 53.49 58.99 65.80 71.30 75.5 5.50 Science-NCR 56.63 60.30 63.98 67.65 71.33 75 3.67 Science-QC 53.65 58.02 62.39 67.65 72.02 75.5 4.37 Filipino-NCR 64.61 66.69 68.77 70.84 72.92 75 2.08 Filipino-QC 63.05 65.54 68.03 70.84 73.33 75.5 2.49 HEKASI-NCR 55.38 59.30 63.23 67.15 71.08 75 3.92 HEKASI-QC 51.66 56.43 61.20 67.15 71.92 75.5 4.77 PERFORMANCE INDICATORS SECONDARY Gross Enrolment Rate NCR QC Male Female Net Enrolment Rate NCR Total Male Female Cohort Survival Rate NCR Total Male Female Completion Rate NCR Total Male Female School Leaver Rate NCR Total Male Female No. of Dropouts Total Male Female 2011 (11-12) 2012 2013 2014 2015 2016 (1617) Annual Increase to Meet the Target 98.43 98.74 99.06 99.37 99.69 100 0.31 96.79 95.3 98.3 78.00 74.69 71.16 78.30 84.47 83.60 80.18 87.04 79.80 79.11 74.95 83.27 5.77 6.01 7.41 4.59 8520 5489 3031 97.10 96.24 98.64 81.00 77.69 75.53 81.24 85.58 84.71 82.14 87.63 81.26 81.15 77.96 84.72 4.91 5.16 6.23 3.97 6816 4391 2425 97.42 97.18 98.98 84.00 84.00 79.90 84.18 86.68 86.00 84.11 88.22 83.45 83.19 80.97 86.16 4.06 4.30 5.05 3.35 5112 3293 1819 97.73 98.12 99.32 87.00 87.00 84.26 87.12 87.79 87.11 86.07 88.82 85.63 85.63 83.98 87.61 3.21 3.45 3.86 2.74 3408 2196 1212 98.05 99.06 99.66 90.00 90.00 88.63 90.06 89.00 88.21 88.04 89.41 86.00 87.67 86.99 89.05 2.00 2.59 2.68 2.12 1704 1098 606 100 100 100 93 93 93 93 90 90 90 90 90 90 90 90.5 1.5 1.5 1.5 1.5 0 0 0 0.64 0.94 0.34 3.00 3.66 4.37 2.94 1.11 1.28 1.96 0.59 2.04 2.18 3.01 1.45 -0.85 -0.90 -1.18 -0.62 -1704.00 -1097.80 -606.20 PERFORMANCE INDICATORS National Achievement Test Fourth Year 2011 (11-12) 2012 2013 2014 2015 2016 (1617) Annual Increase to Meet the Target NCR 49.32 54.46 59.59 64.73 69.86 75 5.14 QC 55.43 60.45 65.46 70.48 75.5 5.02 NCR-English QC-English 50.41 49.01 36.58 38.57 44.26 45.96 51.95 53.34 59.63 60.73 67.32 68.11 75 75.5 7.68 7.39 NCR-Math QC-Math 67.09 67.66 68.67 69.23 70.25 70.80 71.84 72.36 73.42 73.93 75 75.5 1.58 1.57 NCR-Science QC-Science 39.14 40.42 46.31 47.44 53.48 54.45 60.66 61.47 67.83 68.48 75 75.5 7.17 7.02 NCR-Filipino QC-Filipino 53.13 53.25 57.50 57.70 61.88 62.15 66.25 66.60 70.63 71.05 75 75.5 4.37 4.45 NCR-AP QC-AP 53.20 54.92 57.56 59.04 61.92 63.15 66.28 67.27 70.64 71.38 75 75.5 4.36 4.12 NCR-C Thinking QC-C Thinking 50.53 50.70 55.42 55.66 60.32 60.62 65.21 65.58 70.11 70.54 75 75.5 4.89 4.96 Priority Areas ACESS: 1. Congested schools in CD II Data 22 elementary and secondary schools are congested Situational Analysis PPA’s Target Strategies Deconges t 22 schools Use of Technology Rationalize the assignment of teachers 2. Inadequate WATSAN facilities StudentTbowl Ratio = 101:1 Pupil-Tbowl Ratio = 74:1 50% out of 142 schools will have adequate TBowls Enhance enrolment in SPA, ESEP in CD I, III, & IV Social Marketing Develop online learning system for ALS and ADM Procure online learning system infrastructure Capacity building for online ALS/ADM personnel Pilot implementation of online ALS/ADM Procure interactive software to augment MISOSA Assign old vacant items to special program teachers (ALS, SPED, Madrasah, etc.) Transfer old vacant teacher items in CD I, III & IV to CD II Encourage and assist schools like Quirino HS, QCHS & E Rondon HS in establishing SPA and ESEP Conduct counselling and information dissemination program to grade six pupils in CD II schools to encourage them to enrol in schools offering SPA and ESEP Make representation with the LSB for the construction of WATSAN Look for establish partner ship with private entity whose advocacy is health and sanitation Situational Analysis Priority Areas QUALITY: NAT results below mastery level Data GR 3 = 46.96% GR 6 = 54.26% Yr 4 = 50.41 Target Increase NAT MPS to: GR3= 60.98% GR6= 64.63% Yr4= 62.71 Strategies Provide technical assistance to strengthen instructional supervision Enhance teachers competence and commitment Improve and align existing learning materials to special curricula PPA’s Train teachers on mentoring and coaching Require supervisors , school heads and head teachers to conduct instructional supervision to at least 3 times per week. Require schools to conduct inset which is focused on the TSNA and NAT results Mock NAT administration and analysis Train teachers on strategies for teaching least mastered competencies Conduct TIP to all teachers Teachers academy Conduct workshop on the development of NAT parallel test bank Conduct workshop on the development of modules Situational Analysis Priority Areas Data Target Strategies PPA’s EFFICIENCY: High drop-out Rate .47 % Elem 5.62 % HS Decrease drop-out rate by .25% in Elem and 2% in HS Strengthen guidance and counselling program Institutionalize PAP,s Institute programs that will enhance schools efficiency High incidence of malnutrition 12,501 pupils are severely wasted Reduce severely wasted pupils by 35% Improve the wellbeing of pupils Orient and train the guidance counsellors and guidance teachers on the different modalities of preventing/reducing drop-out Train teachers on effective classroom management Conduct search for best school DORP and provide yearly budget to this activity Harmonize GAM, PEPT and ALS A & E implementation Implement health and nutrition programs in schools such as: Feeding program Quarterly dental and medical check-up Deworming Gulayan sa paaralan Situational Analysis Priority Areas GOVERNANCE Data 142 SH Target 142 SH Strategies PPA’s Enhance capacity of school heads in managing school resources Principals academy Policy Governance for education/Temasek Improve schools level of SBM Practice Close monitoring and evaluation of SBM implementation/SBM Level of Practice SBM Grant Intensify disaster and waste management program in school Quarterly conduct of disaster management training Improve teachers welfare and wellbeing Housing committee to screen qualified teacher beneficiaries of socialized housing Enhance internal efficiency ICT supported systems and processes for internal efficiency Proposed FY 2014 Budget DIVISION OF QUEZON CITY Total = P 4,472,918,704 COMPARISON, CY 2013 & 2014 BUDGETS CY 2013 PS CY 2014 4,112,033,000 4,154,199,561 MOOE 360,885,704 360,885,704 TOTAL 4,472,918,704 4,515,085,265 * % increase= 0.94% of CY 2013 budget INCREASE 42,166,561 42,166,561 Programs, Projects, Activities (PPAs) Support to Special Science Elementary Schools . . . . . Php 736,859.00 Support to Regional Science High School . . . . . . . . . . 3,666,000.00 Support to Special Program for the Arts . . . . . . . . . . . . 500,000.00 Support for SPED . . . . . . . . . . . . . . . . . . . . . . . . . . . . . . . 9,882,000.00 Support for ALS . . . . . . . . . . . . . . . . . . . . . . . . . . . . . . . . 10,983,257.00 MADRASAH Program . . . . . . . . . . . . . . . . . . . . . . . . . . . 3,272,000.00 SBM . . . . . . . . . . . . . . . . . . . . . . . . . . . . . . . . . . . . . . . . . 1,341,837.00 Health & Nutrition . . . . . . . . . . . . . . . . . . . . . . . . . . . . . . 4,387,300.00 Engineering and Science Education Program . . . . . . . 963,535.00 Alternative Delivery Mode . . . . . . . . . . . . . . . . . . . . . . . 389,300.00 Support to Multi-Grade Education . . . . . . . . . . . . . . . . . 29,758,764.00 TOTAL _ _ _ _ _ _ _ _ _ _ _ _ _ _ _ _ _ _ _ _ _ _ _ _ _ _ _ _ Php 65,880,852.00 “THE BEST WAY TO PREDICT THE FUTURE IS TO CREATE IT” -Peter Drucker The Division Planning Team: Dr. Corazon C. Rubio, CESO VI Dr. Betty C. Cavo Engr. Araceli T. Liwanagan Ms. Cecil Diaz Mr. Juan C. Obierna Schools Division Superintendent Asst. Schools Div. Superintendent Supervising Educ. Program Specialist Budget Officer Public Schools District Supervisor

