State - Green Resistance
advertisement
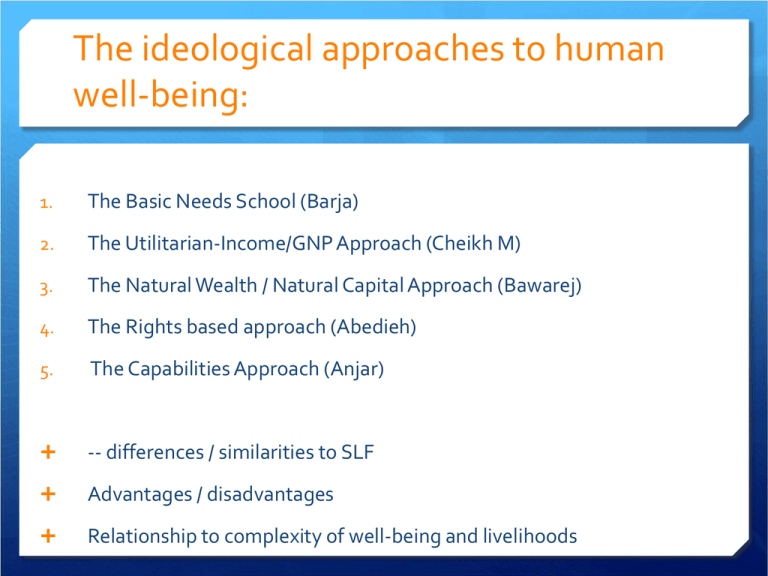
The ideological approaches to human well-being: 1. The Basic Needs School (Barja) 2. The Utilitarian-Income/GNP Approach (Cheikh M) 3. The Natural Wealth / Natural Capital Approach (Bawarej) 4. The Rights based approach (Abedieh) 5. The Capabilities Approach (Anjar) -- differences / similarities to SLF Advantages / disadvantages Relationship to complexity of well-being and livelihoods Other issues Your timeline / methodology (tools) By Friday please (April 1) The End of Poverty – Movie Thursday, April 7 – 6.30 to 8 pm Ta Marbouta 2 DPSIR Integrated analysis of environmental trends and policies Need to answer 3 main questions What is happening to the environment and why? . What are the consequences for the environment and humanity? What is being done and how effective is it? How to answer these questions IEA analyses environment and human well-being trends and dynamics based on the drivers-pressures-state-impactsresponses (DPSIR) framework. 4 Analysis involves… : A. Understanding the issue to determine what is happening to the environment, why and what the impacts are. B. Preparing a policy report card to understand the array of high-level strategies affecting the environmental issue. C. Conducting a policy instrument scan to identify the mix of policies influencing the environmental issue, and the effectiveness of such a mix. D. Performing a policy gap and coherence analysis to determine if relevant policies are in place and are focused on the most important drivers and pressures. 5 Spatial context In principle, you can carry out an IEA analysis for any given issue, geographic area or level of decision making. In practice there usually are two choices: analysis based on jurisdictional (political) boundaries, or on non-political boundaries (e.g.,ecoregion,watershed). only rarely do the two spatial boundaries coincide as they do, for example, in small island states. 6 Temporal Context IEAs combine retrospective integrated analyses with future outlook. Defining the temporal scale—how far do you look back and ahead—is important for conceptual clarity. In which time scale do the environmental issues you want to assess show significant or detectable change? How far back do you expect to have reliable data? How far into the future do you need to or can you project environmental trends? 7 The DPSIR concept Responses Driving forces Impact Pressures State 8 The causal chain 9 Driving forces: A driving force is a need: Individual: Food, shelter etc (Maslows hierachy) Industry: Make profit, lower costs, expand markets Nation: Increase/maintain standard of living, reduce unemployment DFs are the underlying factors that influence development such as population growth, economic growth, energy consumption and industrial production. 10 Pressures: Human activities to meet needs affect the environment through production or consumption processes: Emissions of polluting substances Extraction of natural resources Land use 11 State: Current condition of the environment: Air quality Water quality Soil quality Ecosystems status 12 Impact: Effect of changes on both environment and society. 13 Response: Society can make political, economic or behavioural changes as a reaction to changes in the environment. Responses can be aimed at any of the links in the causal chain (DPSI). 14 Understanding the dynamics of issues: 15 Driving Force - Pressure Relationships The environmental pressures resulting from human activities (emissions, resource use and land use) are a function of two types of variable: (i) the level of these activities (ii) the technology applied in these activities. 16 17 CASE EXAMPLE Telling an integrated story about water quality issues in Canada’s Red River Basin and Lake Winnipeg The Red River flows north from the United States into Canada where it empties into Lake Winnipeg, the world’s 10th largest freshwater lake. The Red River Basin is about 846 000 square km in extent. State: Water quality in the Red River experienced increases in flow-adjusted, total nitrogen and phosphorous concentration between 1978 and 2000,particularly north of the city of Winnipeg and the confluence of the Assiniboine and Seine Rivers. Among the key Drivers: are urban expansion due to population growth and increased agricultural production to meet growing agriculture export demands. Pressures (i.e.,direct drivers): Total N and P [ ] in the Red River arise primarily from non-point source nutrient loading from intensive agricultural production in the Red River Basin, and from urban runoff and sewage discharges from the city of Winnipeg in Canada, and Grand Forks and Fargo in the United States. The decreasing water quality of the Red River is having a serious negative Impact on Lake Winnipeg due to massive and rapid eutrophication. This ecosystem impact affects human wellbeing. a mix of public policies (responses) are implemented by the Manitoba provincial government – eg: 16% reduction in average erosion rates on farmland; 12% reduction in residual N 18 exercise Select one specific issue, and identify the specific environmental STATE that the issue involves. How has this state changed over time? Identify a general societal DRIVER with broad influence on the pressure and environ- mental state. Identify a societal PRESSURE directly affecting that environmental state. What natural disturbances might be causing your environmental state to change? Given the change in your environmental state, what are examples of key IMPACTS on the services that ecosystems provide, and human well-being? What existing policies and policy instruments (including laws and institutions) contribute to restoring or enhancing the environment (e.g., have an influence on the environmental state, pressures and drivers)? What policies and policy instruments have helped (or hindered) the ability of communities and businesses to adapt to impacts of the change in the environmental state? What technologies have facilitated restoration and/or adaptation? 19 20 21 22 EXERCISE Identifying interlinkages among environmental issues From your DPSI Story Sheet, transfer the environmental state, key pressure and associated drivers to the interlinkages table below. Starting from the driver, identify two other pressures and then other environmental states that could change as a result of each pressure. Note the multiple linkages among pressures and environmental states What impacts on the environment and human health are associated with changes in the various environmental states? 23 Example… 24 Analysing themes and sectors 25 26 What about indicators? indicators should: Be developed within an accepted conceptual framework. Be clearly defined and easy to understand. Be subject to aggregation. Be objective. Have reasonable data requirements. Be relevant to users. Be limited in number. Reflect causes, processes or results SMART Specific Measurable Aggressive but achievable targets Relevant Time-bound 27 What about responses? See handout Example: river water quality A number of policy instruments, such as in situ treatment and water quality standards, could have positive or negative impacts on the state of the water quality. Other impacts can come from the effects of municipal taxes driving as urban growth, infrastructure development reducing sewage discharges and food import programmes to compensate for a reduction in fish as a food source. 28 Example policy instrument scan for water quality of rivers 29 To summarize 30 31 32 Problem tree analysis: Why? 33 Problem tree: Identify the problem Whose problem? – perceived as such by the community The following are the basic steps that should be followed with the community, in developing the cause-effect analysis leading to the identification of focal problems and their solutions through the problem tree: 1.Identify, define and select specific main problems or undesired situations within the project scope; 2.For each specific main problem selected develop a problem tree; 3.For each problem tree carry out a comprehensive cause-effect analysis of the situation identifying the focal problems; 34 exercise draw a tree. Write the problem on the trunk of the tree. What are the causes of the problem social, economic, and political causes including attitudes, behavior, and other factors 35 36

![[09]. Strategies for Growth and Managing the Implications of Growth](http://s2.studylib.net/store/data/005486524_1-1f063ac78a31ad020721eab31440cecf-300x300.png)

