- ePrints Soton
advertisement
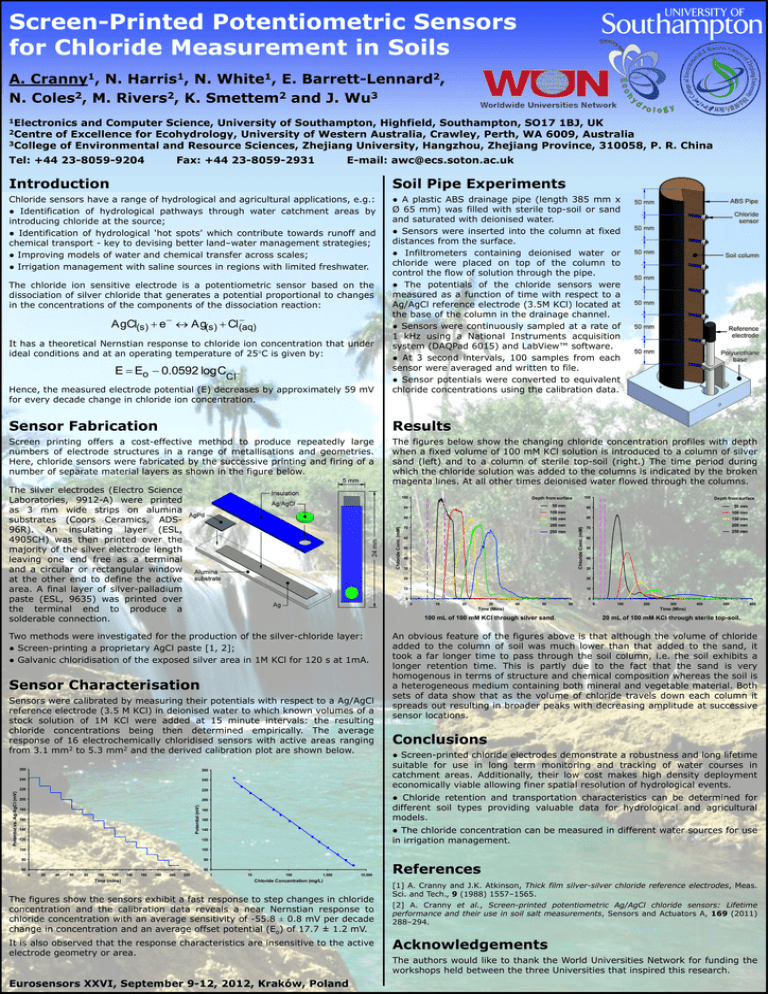
Screen-Printed Potentiometric Sensors for Chloride Measurement in Soils A. Cranny1, N. Harris1, N. White1, E. Barrett-Lennard2, 2 2 2 3 N. Coles , M. Rivers , K. Smettem and J. Wu 1Electronics and Computer Science, University of Southampton, Highfield, Southampton, SO17 1BJ, UK 2Centre of Excellence for Ecohydrology, University of Western Australia, Crawley, Perth, WA 6009, Australia 3College of Environmental and Resource Sciences, Zhejiang University, Hangzhou, Zhejiang Province, 310058, P. R. China Tel: +44 23-8059-9204 Fax: +44 23-8059-2931 E-mail: awc@ecs.soton.ac.uk Introduction Soil Pipe Experiments Chloride sensors have a range of hydrological and agricultural applications, e.g.: ● Identification of hydrological pathways through water catchment areas by introducing chloride at the source; ● Identification of hydrological ‘hot spots’ which contribute towards runoff and chemical transport - key to devising better land–water management strategies; ● Improving models of water and chemical transfer across scales; ● Irrigation management with saline sources in regions with limited freshwater. ● A plastic ABS drainage pipe (length 385 mm x Ø 65 mm) was filled with sterile top-soil or sand and saturated with deionised water. ● Sensors were inserted into the column at fixed distances from the surface. ● Infiltrometers containing deionised water or chloride were placed on top of the column to control the flow of solution through the pipe. ● The potentials of the chloride sensors were measured as a function of time with respect to a Ag/AgCl reference electrode (3.5M KCl) located at the base of the column in the drainage channel. ● Sensors were continuously sampled at a rate of 1 kHz using a National Instruments acquisition system (DAQPad 6015) and LabView™ software. ● At 3 second intervals, 100 samples from each sensor were averaged and written to file. ● Sensor potentials were converted to equivalent chloride concentrations using the calibration data. The chloride ion sensitive electrode is a potentiometric sensor based on the dissociation of silver chloride that generates a potential proportional to changes in the concentrations of the components of the dissociation reaction: AgCl(s) e Ag(s) Cl(aq) It has a theoretical Nernstian response to chloride ion concentration that under ideal conditions and at an operating temperature of 25C is given by: E Eo 0.0592 log CCl Hence, the measured electrode potential (E) decreases by approximately 59 mV for every decade change in chloride ion concentration. Sensor Fabrication Results Screen printing offers a cost-effective method to produce repeatedly large numbers of electrode structures in a range of metallisations and geometries. Here, chloride sensors were fabricated by the successive printing and firing of a number of separate material layers as shown in the figure below. The figures below show the changing chloride concentration profiles with depth when a fixed volume of 100 mM KCl solution is introduced to a column of silver sand (left) and to a column of sterile top-soil (right.) The time period during which the chloride solution was added to the columns is indicated by the broken magenta lines. At all other times deionised water flowed through the columns. The silver electrodes (Electro Science Laboratories, 9912-A) were printed as 3 mm wide strips on alumina substrates (Coors Ceramics, ADS96R). An insulating layer (ESL, 4905CH) was then printed over the majority of the silver electrode length leaving one end free as a terminal and a circular or rectangular window at the other end to define the active area. A final layer of silver-palladium paste (ESL, 9635) was printed over the terminal end to produce a solderable connection. 100 220 220 200 200 Potential (mV) Potential vs. Ag/AgCl (mV) 240 180 160 140 160 100 100 80 80 60 60 120 Time (mins) 140 160 180 200 50 40 30 220 250 mm 60 50 40 30 20 20 10 10 0 0 10 20 30 40 50 60 200 mm 70 0 100 200 300 400 500 600 Time (Mins) 20 mL of 100 mM KCl through sterile top-soil. An obvious feature of the figures above is that although the volume of chloride added to the column of soil was much lower than that added to the sand, it took a far longer time to pass through the soil column, i.e. the soil exhibits a longer retention time. This is partly due to the fact that the sand is very homogenous in terms of structure and chemical composition whereas the soil is a heterogeneous medium containing both mineral and vegetable material. Both sets of data show that as the volume of chloride travels down each column it spreads out resulting in broader peaks with decreasing amplitude at successive sensor locations. Conclusions ● Screen-printed chloride electrodes demonstrate a robustness and long lifetime suitable for use in long term monitoring and tracking of water courses in catchment areas. Additionally, their low cost makes high density deployment economically viable allowing finer spatial resolution of hydrological events. ● The chloride concentration can be measured in different water sources for use in irrigation management. 140 120 100 60 150 mm ● Chloride retention and transportation characteristics can be determined for different soil types providing valuable data for hydrological and agricultural models. 180 120 80 250 mm 100 mL of 100 mM KCl through silver sand. 240 80 200 mm 70 Time (Mins) 260 100 mm 150 mm 0 260 60 50 mm 90 Chloride Conc. (mM) Chloride Conc. (mM) 80 Sensors were calibrated by measuring their potentials with respect to a Ag/AgCl reference electrode (3.5 M KCl) in deionised water to which known volumes of a stock solution of 1M KCl were added at 15 minute intervals: the resulting chloride concentrations being then determined empirically. The average response of 16 electrochemically chloridised sensors with active areas ranging from 3.1 mm2 to 5.3 mm2 and the derived calibration plot are shown below. 40 Depth from surface 100 mm Sensor Characterisation 20 50 mm 90 Two methods were investigated for the production of the silver-chloride layer: ● Screen-printing a proprietary AgCl paste [1, 2]; ● Galvanic chloridisation of the exposed silver area in 1M KCl for 120 s at 1mA. 0 100 Depth from surface 1 10 100 1,000 10,000 Chloride Concentration (mg/L) The figures show the sensors exhibit a fast response to step changes in chloride concentration and the calibration data reveals a near Nernstian response to chloride concentration with an average sensitivity of -55.8 ± 0.8 mV per decade change in concentration and an average offset potential (Eo) of 17.7 ± 1.2 mV. It is also observed that the response characteristics are insensitive to the active electrode geometry or area. Eurosensors XXVI, September 9-12, 2012, Kraków, Poland References [1] A. Cranny and J.K. Atkinson, Thick film silver-silver chloride reference electrodes, Meas. Sci. and Tech., 9 (1988) 1557–1565. [2] A. Cranny et al., Screen-printed potentiometric Ag/AgCl chloride sensors: Lifetime performance and their use in soil salt measurements, Sensors and Actuators A, 169 (2011) 288–294. Acknowledgements The authors would like to thank the World Universities Network for funding the workshops held between the three Universities that inspired this research.

