MDGs
advertisement
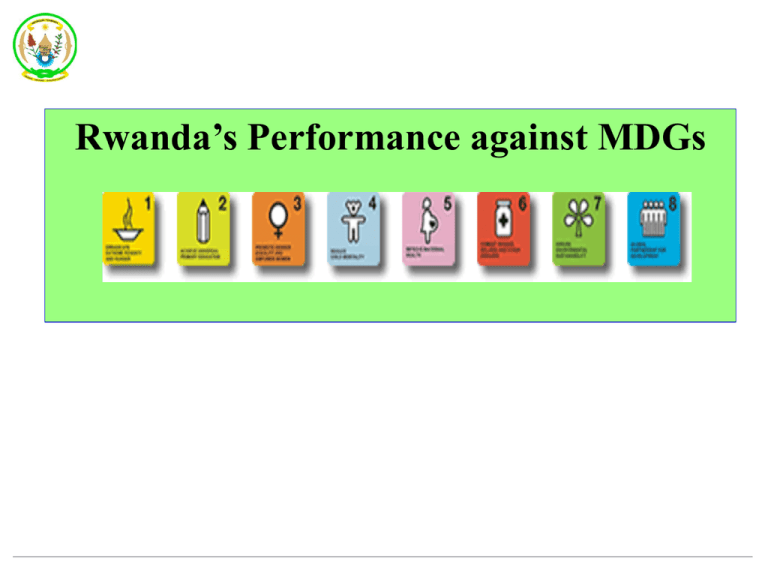
Rwanda’s Performance against MDGs Presentation Outline Introduction Brief Country Profile MDGs in the Rwandan Context Rwanda’s Performance against MDGs Status at a Glance, Challenges, Key Drivers and Lessons Learned, EDPRS 2: Acceleration of MDGs achievement & post 2015 Conclusion 1 Introduction The Millennium Development Goals (MDGs) are a set of eight interdependent goals aimed at reducing poverty and improving the quality of life, particularly of the rural poor, and represent a global partnership resulting from the Millennium Declaration at the UN’s Millennium summit of 2000. 193 United Nations member states and at least 23 international organizations agreed to achieve these goals by the year 2015. The MDGs are internationally considered as benchmarks of the progress a country is making towards sustainable development. 2 Brief country Profile Geographical coverage of 26,338 km2 and a population of about 10.5 million people - implying the highest density in Africa (416 people/Km2 ) Rwanda is bordered in the North by Uganda, East by Tanzania, South by Burundi and DRC in the West The country was almost destroyed in all aspects by the 1994 genocide against the Tutsi, but is on an upward rise in every area thanks to the direction provided by the leadership, commitment of its people & the unwavering support from the friends of Rwanda Positive and high real growth rates (average of 8.2% between 2008 and 2012) but more needs to be done, for instance; In 2010/11, 44.9% were still living under the national poverty line Rwanda’s economy depends mostly on agriculture which employs over 70% of the population EDPRS 2 as a medium-term strategy (2013-2018) aims for better quality of life for all Rwandans by driving the country to middle income status and putting Rwanda on the path to meeting the MDGs and the Vision 2020 targets; 3 Trend for the country’s basic Indicators Rwanda’s basic economic indicators (2007-2013) Basic indicators 2007 2008 2009 2010 2011 2012 2013 Population (in million) 9.5 9.8 10.1 10.3 10.4 10.5 Real GDP growth (%) 7.6 11.2 6.2 7.2 8.2 8 4.6 GDP per capita ($US) 391 479 519 540 593 644 659 Inflation (% average) 9.1 15.4 10.3 2.3 5.7 6.3 4.2 - 4 What internationally agreed MDGs mean to Rwanda Milestones towards the Country’s Vision 2020 & Medium Term Socioeconomic plan (EDPRS) MDGs helped focus on strategic priorities and have been adapted to the local context Monitoring and Evaluation of MDGs is also integrated into the national M&E system The National Dialogue discusses progress on MDGs Rwanda’s Performance against MDGs 6 MDG 1: Eradicate Extreme Poverty & Hunger ( Status at a glance, key drivers, challenges & lessons learned) 7 Poverty levels are reducing…. 80.00% 70.00% Proportion 60.00% 60.40% 57% 50.00% 44.90% 40.00% 30.20% 30.00% Proportion below poverty line 20.00% Linear projection 10.00% 0.00% 2000 2006 2011 2015 8 EDPRS 1 – “the hat trick” 2008-2012 average growth of 8.2% More than 1,000,000 out of Poverty and Back on Track to achieve the MDGs, Health, Education etc. 70.0% Proportion 60.0% 60.4% 57% 50.0% 44.9% 40.0% 30.0% 20.0% 10.0% 0.0% 2000 2006 2011 Proportion below poverty line 9 With Food Security, malnutrition is being eradicated… Proportion underweight 30.00% 25.00% 24.50% 20.00% 19.00% 15.00% 14.50% 11.00% 10.00% Proportion of U5 underweight 5.00% Linear projection 0.00% 2000 2005/06 2010 2015 10 Contrary to the situation in 2000 & 2005, Rwanda is on track to eradicate extreme poverty and hunger Status at a Glance Indicator 2000 2005/06 2010/11 2015 target Status Poverty headcount (%) 60 57 44.9 30 On Track Extreme poverty incidence (%) 41 37 24.1 - 24.3 22.5 11 14.5 Prevalence of under 5 malnutrition (% underweight) Done MDG1: Eradicate Extreme Poverty & Hunger Key Drivers High economic growth rates since 2000 EDPRS 1 Since 2008, higher growth rates in agriculture contributing to food security thanks to programmes like Crop Intensification Program (CIP) that contributed to increasing production and productivity of crops. The Vision 2020 Umurenge (VUP) flagship program of Rwanda’s EDPRS The one-cow per poor family (Girinka) program The Ubudehe program that allows the community to be part of the solution to reduce their poverty MDG1: Eradicate Extreme Poverty & Hunger Challenges or areas of focus Scaling-up existing programs requires more resources Ensuring sustainability of growth and translation into job creation MDG 2: Achieve Universal Primary Education (Status at a glance, key drivers, challenges & lessons learned) 14 MDG2: Universal Primary Education Status at a Glance Indicator Net primary enrolment (%) Completion rate in primary school (%) 2000 2005/06 2010/11 2015 target Status 72.6 86.6 96.6 (2013) 100 On track 22 51.7 78.6 100 On track Gross Primary School Completion Rates and Linear Projection 16 MDG2: Universal Primary Education Key Drivers The remarkable rise in enrollment has been driven by the government program of fee-free education up to the first 9 years of school with 6 of those years being primary schooling years. The fee-free education has been extended to cover 12 years of basic schooling, thereby including the entire secondary school cycle MDG2: Universal Primary Education Challenges and mitigation measures: Managing access shock: Need to build more schools and train more teachers (to reduce pupil to teacher ratio standing at 59.0 in 2012 from 58.0 in 2011) Increase availability of textbooks and teaching aides Managing financial sustainability of fee-free basic education Education solidarity fund (for vulnerable children) at district level Capitation grant to schools - introduced since 2003 Continued focus on further improving Quality MDG 3: Promote Gender Equality and Empower Women ( Status at a glance, key drivers, challenges & lessons learned) 19 MDG3: Promote Gender Equality and Empower Women Status at a Glance Indicator 2000 2005/6 2010/11 2015 Target Status Proportion of seats held by women in national parliament (%) 26.0 48.8 64 (2013) 50 Done Girls to boys ratio in primary 1.00 1.03 1.03 1.00 Done Girls to boys ratio in secondary 0.51 0.81 0.93 1.00 On track Gender gap in literacy (15-24 Yrs) - 0.99 1.02 1.00 Done 20 MDG 3: Promote Gender Equality and Empower Women Key Drivers Policies & law reforms to promote gender equality: Laws discriminating against women were abolished e.g.; The 2003 Constitution provides for at least 30% of seats to women in parliament Women now have rights to property and inheritance Active fight against Gender Based Violence (GBV)- e.g. Isange” One Stop Centre established to provide comprehensive response, care and support services to girls and boys, women and men survivors of Gender Based Violence (GBV) or child abuse Women Economic empowerment programmes; Access to financial services through women guarantee fund, women entrepreneurship program etc Institutional mechanisms that enhance gender accountability i.e. Gender Machineries including; Ministry of Gender and family Promotion, Gender Monitoring Office, National Women Council etc MDG 3: Promote Gender Equality and Empower Women Challenges Changing culture is not as easy as amending laws (it requires a lot of sensitization efforts and takes time) Percentage of women in off farm jobs is still very low- Reversing the current status is critical to improving the economic status of mainly women headed households MDG 4 & 5: Reduce Child Mortality & Improve Maternal Health ( Status at a glance, key drivers, challenges & mitigation measures) 23 MDGs 4 and 5: A Healthier Population Maternal Mortality Under-Five Mortality 250 1071 1000 200 800 750 600 476 400 200 Number of Deaths per 100,000 live Births 268 Linear projection 0 2000 2005 2010 2015 Number of Deaths Per 1000 Births Number of Deaths per 100,000 Live Births 1200 196 152 150 100 50 Number of deaths per 1000 Births Linear projection 72 47 0 2000 2005 2012 2015 MDGs 4 & 5 Maternal and child mortality Status at a Glance Indicator 2000 2005/06 2010/11 Target 2015 Status Infant mortality rate (per 1000 births) 107 86 50 28 On track Under five mortality 196.0 152 72 (2012) 47 On track Proportion of 1 year-old children immunized against measles 87 85.6 95 100 On track % of children 12-23 months 76 fully vaccinated 75.2 95 100 On track Proportion of births attended by skilled health personnel 39 69 - 31 25 MDGs 4& 5 Maternal and child mortality Status at a Glance Indicator 2000 2005/06 2010/11 Target 2015 Women 15-49 using modern contraceptive method 4.3 10.3 49 - Antenatal care coverage (at 92.5 least 1 visit) 94.4 98 100 Unmet need for family planning 17.7 37.9 18.9 - Contraceptive prevalence rate 4.3 16.3 45.1 - Status On track 26 MDG 4 & 5: Reduce Child Mortality & Improve Maternal Health Key Drivers: Improvements in vaccination coverage over this period have been significant contributors with the proportion of children having all vaccinations increasing from 75% in 2006 to 90% in 2011. Over 95% of children are vaccinated against measles. The key driver for MDG5 has been an increase in the percentage of delivery assisted by skilled providers which has also increased from 39% in 2006 to 69% in 2011. 4/8/2015 27 MDG 4&5: Child & Maternal Mortality Challenges and mitigation measures: Child and Maternal mortality ratios need to reduce further Quality of health care needs to be further improved Introduction of Community Health Workers is instrumental in getting children treated within 24hours of onset of fever, pneumonia and diarrhea (leading causes of childhood deaths) Increase access to reproductive health services Improving antenatal and emergency obstetrical care MDG 6: HIV / AIDS, Malaria & Other Diseases ( Status at a glance and key drivers) 29 MDG6: HIV/AIDS, Malaria & other Diseases Status at a Glance Indicator 2005/6 2010/11 2015 Target HIV prevalence in population aged 15-24 (%) 1 1 - HIV/ AIDS prevalence rate 3 3 - Malaria related deaths (% per 52 100 000 persons) 37.7 7.6 5.1 Proportion of children under 5.0 five sleeping under insecticidetreated bed nets 59.7 69.6 - TB-related mortality 100,000 persons 6 5 - 4/8/2015 2000 13 per 6 Status On track 30 Mother-to-Child HIV Transmission Rate at 6 Weeks, 2005 -2010 21.5 13.7 3 2005 2007 2008 2.6 2009 2.6 2010 31 Malaria Mortality Ratios: Under 5 Years and 5 Years and Over, 2005 – 2010 32 MDG 6: HIV/AIDS, Malaria & other Diseases Key Drivers: Access to ARVs increased to reach universal access (covered under Mutuelles health insurance scheme) Pregnant women and children under 5 getting free treated bed nets. Antiretroviral treatment for all HIV/AIDS patients is provided with subsidization after they seek treatment at a health center. MDG 7: Ensure Environmental Sustainability ( Status at a glance and key drivers) 34 MDG7: Environment Sustainability Status at a Glance Indicator 2000 2005/06 Land area covered by forest (%) 12.4 20 Terrestrial area protected (%) - 2015 Target Status 24.5 (2014) 25 On track 8 10.1 10 Done Proportion of population 64.1 using an improved drinking water source(%) 70.3 74.2 82.0 On track Proportion of population using an improved sanitation facility 58.5 74.5 - - 51.5 2010/11 MDG7: Environment Sustainability Key Drivers: Establishment of institutions to closely monitor & champion environment protection e.g. Rwanda Environment Management Authority Passing of laws determining the use and management of land preserving wetlands and forests Banning of non-biodegradable plastic bags Protection of river banks and lake shores Tree plantation programs Rainwater harvesting in public and private institutions MDG 8: Develop a Global Partnership for Development (Status at a glance and key drivers) 37 MDG 8: Global partnership for Development Status at a Glance Indicator 2000 2005/06 Debt Service as a percentage of export goods and services - 8.0 Mobile cellular subscriptions per 100 inhabitants - - 2010/11 2015 Target Status 10.13 10.0 Done 65 (2014) - - MDG 8: Global partnership for Development On Partnerships; Rwanda regards regional and international economic integration as a key element to improve Rwanda’s opportunities to achieve faster growth and poverty reduction. As such, Rwanda is a member of; Key regional and international arrangements: the AU, EAC, COMESA ,CEPGL and Commonwealth. Has international trade agreements such as those with the EU and USA. Partnerships have also been built between government and the development partners to enhance mutual accountability and more ODA is committed to the sector wide approach (SWAp) 39 MDG 8: Global partnership for Development Unblocking the country’s landlockedness through leveraging ICT is a key priority for the Country, as such; Rwanda signed an MOU with Korea Telecom (KT) in 2013 to deploy a high-speed (4G LTE ) broadband network to cover 95 per cent of the population in three years. Currently Kigali city has been covered. Liberalization of mobile telecommunication industry 40 EDPRS 2 Contribution to MDGs Strategies enshrined in EDPRS 2 entail measures to accelerate achievement of MDGs but were also designed with the post MDG perspective 41 Focus Areas for EDPRS 2 (2013-2018) OBJECTIVES TARGETS Rapid economic growth Avg. GDP growth from 8.3% to 11.5% GDP per capita from $900 to $1240 Increased growth in all sectors Agriculture from 5.9% to above 8.5% p.a. Industry from 9.3% to above 14% p.a. Services from 10.5% to above 13.5% p.a. Structural Shift of the economy Agriculture from 34% to 25% of GDP Industry from 16% to 20% of GDP Services from 50% to 55% of GDP Close the external trade balance Exports: Increase avg. Growth of 28% p.a. Imports: Maintain17% p.a. avg. growth Conclusion All MDGs in Rwanda are achievable: there has been substantial progress in many areas over the last decade – (although progress is not uniform for each and every target under the goals, contextualisation is important) The main challenge today and post-2015 will be ensuring sustainability of results We therefore need to deliver on inclusive economic progress to strengthen the impact and ensure sustainability of results The strategies and priority areas of EDPRS 2 will lead to the attainment of MDGs since EDPRS 2 was elaborated with the objective of accelerating achievement of MDGs but also mindful of post 2015 Government of Rwanda is also mindful of the fact that MDGs are “a floor and not the ceiling” as noted by H.E Paul Kagame, President of the Republic of Rwanda. THANK YOU
