lecture 07-04-2010.oils shale
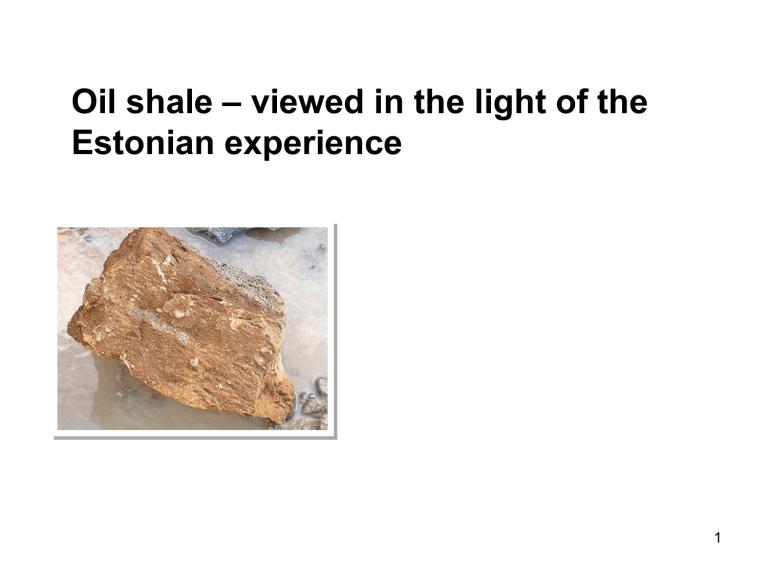
Oil shale – viewed in the light of the
Estonian experience
1
What is Oil Shale ?
Oil shale is a sedimentary rock containing organic matter rich in hydrogen, known as kerogen Estonian oil shale:
C
10
H
15.2
O
0.93
S
0.08
N
0.03
Oil shales of different deposits differ by, for example, genesis, composition, calorific value and oil yield
Oil shale also contains mineral matter. In Estonian oil shale carbonates and sandy-clayey minerals
2
Global shale oil resources (million US barrels)
3 500 000
3 170 000
3 000 000
2 500 000
2 000 000
2 100 000
1 500 000
1 000 000
500 000
0
Global
159 000
Africa
372 000 372 000
84 000
Asia Australia Europe North
America
83 000
South
America
3
Grade of the global oil shale deposits in liters of oil per ton
> 150 l/t
1%
90-150 l/t
31%
< 45 l/t
25%
45 - 90 l/t
43%
4
European shale oil resources (million US barrels)
300 000
250 000
247 883
200 000
150 000
100 000
73 000
50 000
18 686
7 000 6 988 6 114 4 193 3 500 2 000 675 690 305 280 125 55
48 8
0
R ussi a
Ital y
Esto ni a
Fr an ce
B el ar us
Swe den
U kr
U ni ted ai ne
K in gd om man y
Ger
Lu xemb
Yu ou rg go sl avi a
A rmen ia
Sp ai n
B ul ia gar
H un y d gar
Po lan
A ustr osl ia ovak ia
C zech
6
5
Production of oil shale in million metric tons from selected oil shale deposits from 1880 to
2000
6
Estonian oil shale reserves by fields and structure of the layer
a) b) a) 1 – outcrop line of the shale bed; 2 – exhausted areas; 3 – operating mines and opencasts;
4 – mine field boundary; 5 – county boundary; 6 – boundaries of parts of Estonia deposit; 7 – southern boundary of Estonia deposit; 8 – active reserve; 9 – passive reserve b) 1- limestone, 2 – limestone kerogeneous, 3 – oil shal, thickness of the layer 2-3m
7
Oil Shale Mining
underground mining opencast mining enrichment of oil shale reforestation of exhausted opencast areas
8
What can we produce from 1 ton of Estonian oil shale?
From 1 ton of oil shale (2030 kcal/kg)
125 kg of shale oil (9 500 kcal/kg)
35 Nm³ of retort gas (11 200 kcal/m³)
850 kWh of electricity
9
Material flow in the Estonian Oil Shale industry, 2005
OIL SHALE
MINING
14.7 Mt/y
SHALE OIL
PRODUCTION
2.8 Mt/y
POWER
GENERATION
10.9 Mt/y
HEAT
PRODUCTION
0.7 Mt/y
CEMENT
PRODUCTION
0.3 Mt/y
Shale oil
400 000 t/y
Power
9 300 GWh/y
Heat
1 500 GWh/y
Cement
820 000 t/y
10
The development of thermal processing of oil shale in Estonia
Low-temperature (500–550 ºC) thermal processing
The use of lumpy oil shale (25–125mm)
1924 to date
1928–1960s
1931–1961
Internally heated vertical retorts,
(Pintsch retorts →Kiviter process)
10t → 40t →100t →200t →1000t (→ 1500t, designed) oil shale per day
Tunnel ovens (horizontal, internally heated)
400t oil shale per day
The Davidson rotary retorts (horizontal, externally heated)
25t oil shale per day
The use of fine-grained oil shale (<25mm)
1980 to date Galoter process with solid heat carrier
3000t oil shale per day
High-temperature (> 700 ºC) thermal processing of lumpy oil shale (25–125mm)
1948–1970 Chamber ovens for gasification of oil shale 400 million m3 gas per year
11
Development of power and heat production from oil shale in Estonia
Construction date
1930s
1949–1967
1952–1957
1959–1971
1969–1973
1995
2004
Plant MW electricity
11
39
MW heat
Tallinn
Kohtla-
Järve
Ahtme
534
20 338
Balti
1624
inc. 4 blocks at 200
MWe and 8 blocks at 100 MWe pulverized firing boilers
686
Eesti
1610 inc. 8 blocks at 200
MWe pulverized firing
84 boilers renovation of turbines, extra repairs of boilers, new electrostatic precipitators, demolition of old blocks two 215 MW Circulated Fluidized Bed (CFB) units commissioned in Balti and Eesti Power
Plant
12
Emissions from Oil Shale Power Plants
1990-2004, 2005,2006 ton/year
200 000
Emissions from Oil Shale Power Plants
SO2
160 000
Fly ash
120 000
NOx
80 000
40 000
0
1990 2004 2005 2006
13
Emissions from oil shale fired boilers
SO2 bounded
SO2 emissions
PC Boilers
80 %
CFB Boilers almost 100 %
800-2000 mg/Nm3 0 – 20 mg/Nm3
NOx emissions 300 mg/Nm3
1.18 kg/kWhe
Fly Ash Emissions < 200 mg/Nm3
Net Efficiency of
Power Generation 28-30%
CO2 kg/kWhe
90 – 170 mg/Nm3
< 30 mg/Nm3
34-36%
1.0 kg/kWhe
14
The Environmental Requirements
Influencing on Operation of Oil Shale Fired
Power Plants
•01.01.2008.a.
– SO
2 binding on existing boilers >65%,
– fly ash emissions < 200 mg/Nm 3
•16.07.2009.a.
– to reconstruct ash handling systems, and bring ash landfills in compliance with landfill directive
• 01.01.2012.a.
– SO
2 emissions total <25 000 ton/year
• 01.01.2016.a.
– Directive on the limitation of emissions of certain pollutants into the air from large combustion plants requirements will apply to all PC boilers, closing of PC boilers:
2004 - 4, 2008 - 4, 2010 - 4
15
Estonian oil shale provides:
Self-sufficiency for power and heating oil
Energy security
Economic efficiency, profitability
-Production prices of oil shale is ~ 8.5 euro per ton including resource and environmental taxes ~5.5 %
-Production prices of power MWh 28.2 (nuclear, Ignalina 23.7 ) including environmental taxes ~12%
Directive 2004/74/EC oil shale taxation in any form is not required before
1 January 2009
- Selling price of shale oil is about 230-250 euro per t (31-34 euro per barrel) and it depends from crude oil price in the European market
16
Energy balance in Baltic countries, 2005
Estonia Total in Baltic
Consumption of primary energy, M toe 5.64
own production, % 71.1
Total capacity power plants, MW
after closure of Ignalina *), MW
2300
Production of electricity, TWh
nuclear, %
hydro, %
natural gas, %
oil shale, %
renewable, %
10.3
-
-
6.6
92.6
0.8
19.34
62.2
8800
7500 *)
34.3
44.1
11.8
14.0
27.8
2.3
17
Huge oil shale resources in the world represent an important source for future energy supply
1.
Oil Shale could be a useful part of an overall EU energy policy. Oil shale usage contributes to the security of energy supply in Baltic region
2.
Direct combustion of oil shale for electricity production has shown a good technical progress and economic efficiency as one of the cheapest kinds of power in the Baltic region. Oil shale is also a useful source of oil and chemicals
3.
The long-term experience of oil shale utilization in Estonia has turned into valuable know-how for using oil shale of different deposits over the world
4.
EU should support efforts to further exploitation of the energy potential hidden in oil shale of the EU member states
18
Back-up information
19
CO2 Emissions from Power Plants ton/year
25 000 000
20 000 000
15 000 000
10 000 000
5 000 000
0
19 453 129
11 024 408
9 964 389
1990 2004 2005
9 249 960
2006
20
Oil Shale oil retorting process
Drying
Thermal decomposition
Combustion
To condensation
21
Oil Shale Mineable Seam
• The mineable oil shale seam is of Middle Ordovician age and consists of seven sub-seams (denominated A through F1) that are divided by limestone partings of various thicknesses.
• Within the active mining areas, the thickness of this oil shale seam, without partings, ranges between 1.7 m and 2.3 m
22
CFB-Combustion System for Oil Shale
Net Heat to Steam
With oil shale
With shale oil
247 MWth
112,5 MWth
Main Steam 90 kg/s l 535’C l 12.7 MPa
Hot Reheat 77 kg/s l 535’C l 2.4 MPa
Steam Drum 13.3 MPa
NET EFFICIENCY ~37%
23
Oil Shales share in power production in Estonia is over 95%
Eesti Power Plant 1615 MW Balti Power Plant 765 MW
Worlds biggest oil shale power plants are in Estonia
24
Oil Shales share in power production in Estonia is over 95%
Eesti Power Plant
1615 MW
Balti Power Plant 765
MW
Oil Factory
Worlds biggest oil shale power plant is Eesti PP
25
