Human Population Growth
advertisement
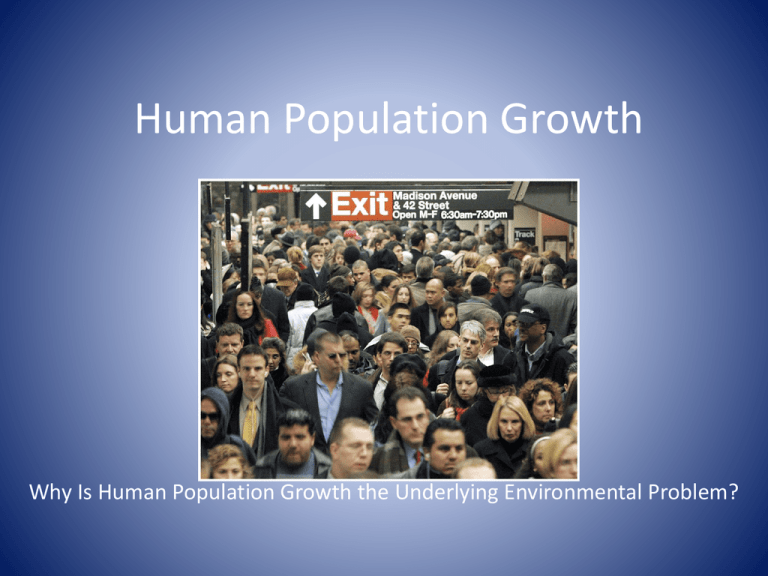
Human Population Growth Big Question Why Is Human Population Growth the Underlying Environmental Problem? China’s One Child Policy In the 1970’s China began a one child policy to control population growth in their country. Chinese culture values males as more important than female. This policy has lead to some killing of girl babies and high number of abortions in China. Incentives are given to have one child and if a family has more than one, the incentives are taken away. What do you think about the policy of only allowing 1 child per family? Basic Concepts of Population Dynamics – A population is a group of individuals of the same species living in the same area or interbreeding. – A species is all individuals that are capable of interbreeding and is made up of populations. – Abundance is the size of a population. – The birth rate is the number of individuals born during a specified time interval. – The death rate is the number of individuals who die during that same time interval. – The growth rate is the difference between birth rate and death rate; the net change in the size of the population. Factors Governing Changes in Population Size • Four variables – births, deaths, immigration and emigration • Population Change = (births + immigration) – (deaths + emigration) • Crude Birth Rate = CBR = (births/population)*1000 • Crude Death Rate = CDR = (deaths/population) *1000 • Immigration and emigration are calculated the same way • Crude Growth Rate = CBR = CDR • Population Growth Rate = CGR * 100 Calculating Population Growth • • • • • N0 is the starting population N is the population after a certain time, t , has elapsed, r is the rate of natural increase expressed as a percentage (birth rate - death rate) and • e is the constant 2.71828... (the base of natural logarithms) Doubling Time • The time it takes for a population to double at a specific growth rate • Rule of 70 – to find the doubling time of a quantity growing at a given annual percentage rate, divide the percentage number into 70 to obtain the approximate number of years required to double. • For example, at a 10% annual growth rate, doubling time is 70 / 10 = 7 years. Factors that Drive Human Population Growth • Demography- the study of human populations and population trends. • Changes in Population Size • Fertility • Life Expectancy • Age Structure • Migration Fertility • Total fertility rate- an estimate of the average number of children that each woman in a population will bear. • Replacement level fertility- the total fertility rate required to offset the average number of deaths in a population and for the current population size to remain stable. Fertility • Varies drastically among developed and developing nations – Developed countries- countries with relatively high levels of industrialization and income. – Developing countries- countries with relatively low levels of industrialization and income of less that $3 per person per day. Life Expectancy • Life expectancy- the average number of years that an infant born in a particular year in a particular country can be expected to live, given the current average life span and death rate of that country. Life Expectancy • Infant mortality rate- the number of deaths of children under 1 year of age per 1,000 live births. • Child mortality rate- the number of deaths of children under age 5 per 1,000 live births. Age Structure • Age structure diagrams (population pyramids)visual representations of age structure within a country for males and females. • Arranged in cohorts – age groups Four general types: – – – – Pyramid Column Inverted pyramid Column with bulge Population Change, cont. – Kenya has pyramid shape with many young people – rapid growth – United States has column shape – slow growth – Italy is slightly top-heavy – slow/negative growth Major Periods of Human History – The early period of hunters and gatherers - less than a few million people – The rise of agriculture - first major increase in the human population – The Industrial Revolution - improvements in the food supply and health care led to a rapid population growth – Today -growth has slowed in industrialized nations but is increasing rapidly in many less developed nations Is the Logistic Growth Curve Realistic? – Requires accurate knowledge of the inflection point where growth rate declines. – Unrealistic assumptions for human populations. – Death rates do not increase if there are ongoing improvements in health care and food supplies. – See the estimated US population at Population Clocks: http://www.census.gov/main/www/popclock.h tml The Demographic Transition • The theory of the demographic transition is the theory that as a country moves from a subsistence economy to industrialization and increased affluence, it undergoes a predictable shift in population growth. The Stages of the Demographic Transition • Phase 1: Slow population growth because there are high birth rates and high death rates which offset each other. • Phase 2: Rapid population growth because birth rates remain high but death rates decline due to better sanitation, clean drinking water, increased access to food and goods, and access to health care. • Phase 3: Stable population growth as the economy and educational system improves and people have fewer children. • Phase 4: Declining population growth because the relatively high level of affluence and economic develop encourage women to delay having children. The Demographic Transition Longevity and Its Effect on Population Growth – The maximum lifetime (longevity) is the genetically determined maximum possible age to which an individual can live. – Life expectancy is the average number of years an individual can expect to actually live. – The human population has grown despite little or no change in longevity. The Demographic Transition, cont. – Some nations are slow to move from stage II to stage III – Medical advances can affect the demographic transition by decreasing death rates Limiting Factors to Population Growth – Short-term factors: drought, disruption to energy supply, disease – Intermediate-term factors: desertification, pollutants, disruption to supply of nonrenewable resources – Long-term factors: Soil erosion, groundwater, climate change Quality of Life and the Human Carrying Capacity of the Earth – What is the human carrying capacity of Earth? – Logistic curve predictions – Packing space – Deep Ecology – moral imperative to preserve the biosphere by limiting human population – The higher the quality of life, the lower the Earth’s carrying capacity How Can We Achieve Zero Population Growth? – Raise the age of first childbearing – Social pressures to delay marriage – Birth control • Breast feeding • Family planning National Programs to Reduce Birth Rates – The first country to adopt an official population policy was India in 1952. – Many countries now have a family-planning program. – China has one of the oldest and most effective familyplanning programs: • encourages couples to have only one child. • relies on education, family planning control, and a system of rewards and penalties. – Should governments force people to limit family size? Family Planning • Family planning- the regulation of the number or spacing of offspring through the use of birth control. Ecological Footprints • Affluence - having a lot of wealth such as money, goods, or property. How Many People Can Earth Support? Estimates range from 2.5 billion to 40 billion. Critical factors are – Food supply – Land and soil resources – Water resources – Population density – Technology
