Pesticides Forum Annual Report 2012 presentation
advertisement
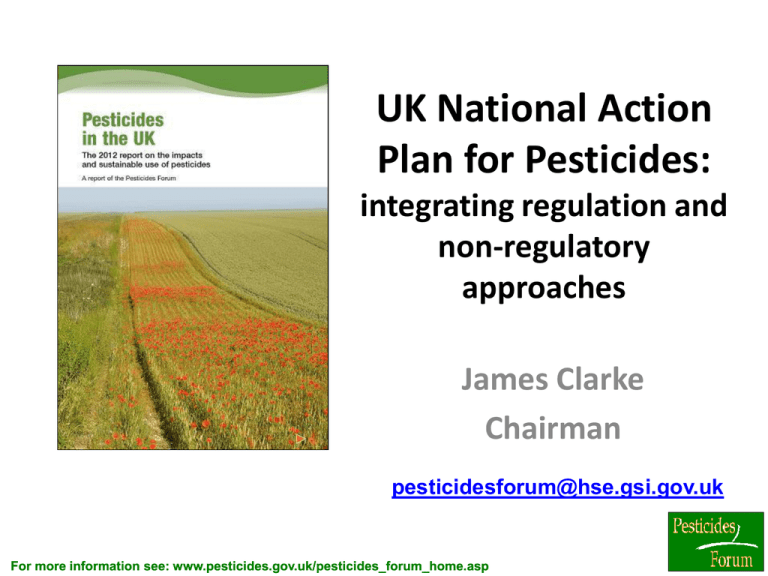
UK National Action Plan for Pesticides: integrating regulation and non-regulatory approaches James Clarke Chairman pesticidesforum@hse.gsi.gov.uk For more information see: www.pesticides.gov.uk/pesticides_forum_home.asp Presentation content • The role of the Pesticides Forum (PF) • Thematic strategy (for pesticides) • The UK National Action Plan (NAP) – EU context – UK approach • Indicators of Sustainable Use – By key heading in NAP • Summary and future plans For more information see: www.pesticides.gov.uk/pesticides_forum_home.asp Pesticides in the UK • Pesticides Forum annual report • Impacts and sustainable use • PPT of data available www.pesticides.gov.uk/pesticides_forum_home.asp For more information see: www.pesticides.gov.uk/pesticides_forum_home.asp About the Pesticides Forum Members, objectives and topics covered For more information see: www.pesticides.gov.uk/pesticides_forum_home.asp Pesticides Forum Membership Organisations Users, Advisors, Manufacturers, Environment, Consumers ADAS Fresh Produce Consortium/British Retail Consortium The Organic Sector The Game & Wildlife Conservation Trust (GWCT) Advisory Committee on Pesticides (ACP) Linking the Environment & Farming (LEAF) Agricultural Engineers Association (AEA) National Farmers’ Union (NFU) Agricultural Industries Confederation (AIC) National Farmers’ Union Scotland (NFUS) Agriculture & Horticulture Development Board (AHDB) Pesticide Action Network (PAN-UK) The Amenity Forum Scotland’s Rural College (SRUC) BASIS (Registration) Ltd Scottish Natural Heritage (SNH) The Co-operative Farms SUSTAIN Country Land & Business Association (CLA) Unite Crop Protection Association (CPA) Voluntary Initiative (VI) Environment Agency (EA) Wildlife & Countryside LINK (WCL) Women’s Food & Farming Union (WFU) For more information see: www.pesticides.gov.uk/pesticides_forum_home.asp Aims and Objectives Aims: • To oversee work under the UK National Action Plan • To monitor the effects of policies, laws and other initiatives that affect or are affected by the use of pesticides, and • To offer advice to Ministers and stakeholders • To provide a forum for exchanging views, and where possible to allow our stakeholders to come to a general agreement Specific Objectives: • Communications • Monitoring impacts • Knowledge transfer For more information see: www.pesticides.gov.uk/pesticides_forum_home.asp Available from: https://www.gov.uk/government/publications/pesticides-uk-national-action-plan The UK National Action Plan For more information see: www.pesticides.gov.uk/pesticides_forum_home.asp Thematic strategy (for PPPs) Authorisation regulation 1107/2009/EC Pre-marketing Sustainable Use Directive 2009/128/EC Machinery Directive 2009/127/EC (Amended) Pesticides and Waste law Use Disposal/degradation For more information see: www.pesticides.gov.uk/pesticides_forum_home.asp Statistics regulation 1185/2009/EC National Action Plan (NAP) • NAP setting objectives, targets, measures and timetables • Indicators to monitor products containing substances of concern • Use reduction targets if appropriate for risk reduction • To take account of health, social , economic and environmental impacts, national, regional and local conditions and other legislation (e.g. WFD) • Public participation • To Commission by November 2012 and reviewed 5 yearly For more information see: www.pesticides.gov.uk/pesticides_forum_home.asp R&D Assurance schemes Regulation UK National Action Plan: Approach • Outlines pesticides legislative regime – Authorisation, MRLs, Sustainable Use Directive • Explains government’s wider strategic priorities – reducing burdens in business, improving productivity and competitiveness of farming, enhancing the environment and biodiversity – adopting a proportionate approach to regulation and removing unnecessary burdens • Clarifies roles – Defra with strategic oversight, government and non-governmental organisations to work together • Stakeholder consultations, role for the Pesticide Forum, supported by short-life and standing working groups For more information see: www.pesticides.gov.uk/pesticides_forum_home.asp R&D Assurance schemes Regulation National Action Plan (NAP) • Required under implementation of the Sustainable Use Directive for PPPs • Provides framework for: – reducing the risks and impacts of pesticide use on human health and the environment – promoting the use of integrated pest management and of alternative approaches or techniques, such as non-chemical alternatives to pesticides. For more information see: www.pesticides.gov.uk/pesticides_forum_home.asp National Action Plan R&D Assurance schemes Regulation For more information see: www.pesticides.gov.uk/pesticides_forum_home.asp R&D Assurance schemes Regulation Role of PF and NAP • Ensure appropriate regulation and compliance • Encourage current best practice • Monitor progress (indicators) • Identify and promote even better practice – Regulation – Industry initiatives – Research and Development • Short-life working groups For more information see: www.pesticides.gov.uk/pesticides_forum_home.asp R&D NAP – main headings Assurance schemes Regulation • Training – Improving standards – Operators - (R), advisers • Sales – storekeeper certification • Information and awareness raising – Consumer and health protection, wildlife protection • Inspection of application equipment – Sprayer testing (R)- every 3 years from 2020; Annual (Assurance Schemes) • Aerial application – very limited, permitted application only • Protection of aquatic environment and drinking water • Risk in specific areas – Protected areas, amenity • Handling & storage, packaging – Sub-group & communication • Integrated Pest Management (IPM) – encourage and support uptake – Baselines, sectoral needs, IPM Plans • Indicators – Usage data (R), needs For more information see: www.pesticides.gov.uk/pesticides_forum_home.asp R&D Assurance schemes Regulation Key issues: NAP • Protection of water • Best practice in Amenity and Amateur • Integrated approaches – Availability and viable techniques – Adoption For more information see: www.pesticides.gov.uk/pesticides_forum_home.asp Indicators of Sustainable Use 3 For more information see: www.pesticides.gov.uk/pesticides_forum_home.asp Part 1: Training 4 For more information see: www.pesticides.gov.uk/pesticides_forum_home.asp Training and Certification Training – initial and on-going – by November 2012 • Access for users, distributors and advisors, to recognise different roles • Training bodies designated by the competent authorities. Certification - by November 2013 • Establish certification systems. Designate competent authorities responsible for implementation • Establish requirements and procedures to grant, renew and withdraw certificates. For more information see: www.pesticides.gov.uk/pesticides_forum_home.asp R&D Assurance schemes Training Regulation • Context Importance of training, market is able to meet demand and deliver to an appropriate quality. Retailer assurance schemes promote continuing professional development • Regulation Law requires that all users must be trained initially. CRD has established system for designation of training bodies. Content of existing training courses has been updated • Non-regulatory Industry has developed continuing professional development training programmes for users and initial and ongoing training for advisors and distributors For more information see: www.pesticides.gov.uk/pesticides_forum_home.asp Figure 1: Indicator - User practice: National Register of Sprayer Operators (NRoSO) (number of members & % sprayed area) NRoSO Members % sprayed area covered 25,000 90 80 70 60 15,000 10,000 50 40 30 5,000 20 10 0 Source: VI Annual Report 2011-2012 For more information see: www.pesticides.gov.uk/pesticides_forum_home.asp 0 % sprayed area number of tests 20,000 Figure 2: Indicator - User Practice: BASIS professional register (number of members) number of members Membership of BASIS Professional Register 5,000 4,500 4,000 3,500 3,000 2,500 2,000 1,500 1,000 500 0 Source: BASIS *2012 figure as at 31 Jan 2013 For more information see: www.pesticides.gov.uk/pesticides_forum_home.asp Part 2: Sales . For more information see: www.pesticides.gov.uk/pesticides_forum_home.asp Sales • distributors of non-professional products to provide general information on risks/mitigation/low-risk alternatives. by November 2015 • distributers of professional products have sufficient staff with training certificate in employment. • Staff with certificate to be available at time of sale. • Micro-distributors may be exempt if not selling certain types of products. • Member states to take measures to restrict sales of professional products to persons holding the certificate. For more information see: www.pesticides.gov.uk/pesticides_forum_home.asp R&D Assurance schemes Sales Regulation • Context Pesticides purchased ‘on account’. Responsible distributors make enquiries before selling to persons ‘unknown’ • Regulation Law requires: distributors to have sufficient staff with certificate available at point of sale; any person who purchases a pesticide to ensure end user holds a certificate; distributors of non-professional products to provide general information; and that storekeepers take ‘reasonable precautions’ to protect human health and the environment • Other measures – High standards promoted by BASIS nominated storekeeper certificate – Information for non-professional products on simple/clear labels and Amateur Liaison Group For more information see: www.pesticides.gov.uk/pesticides_forum_home.asp Figure 3: BASIS Nominated Storekeeper (NSK) / Amenity Storekeeper (Amenity NSK) training courses: Total number of successful candidates Amenity NSK, 1294 NSK, 5029 Source: BASIS For more information see: www.pesticides.gov.uk/pesticides_forum_home.asp Figure 4: BASIS Garden Centre qualification (Guardian Certificate in Garden Care): number of candidates and passes No. of candidates No. of passes 80 70 60 50 40 30 20 10 0 Year Source: BASIS For more information see: www.pesticides.gov.uk/pesticides_forum_home.asp Part 3: Information and awareness raising 4 For more information see: www.pesticides.gov.uk/pesticides_forum_home.asp Information and awareness raising • Member states to take measures to inform the public and facilitate information and awareness raising programmes • Information should be balanced and accurate and cover risks to human health and the environment and use of non-chemical alternatives • Member states to put in place systems for gathering information on pesticide poisoning incidents For more information see: www.pesticides.gov.uk/pesticides_forum_home.asp R&D Assurance schemes Information and awareness raising Regulation • Context Active sharing of information by government and stakeholders. EU Commission developing guidance document on monitoring systems • Regulation Revised labelling to products (e.g. hard surfaces) • Other measures Reviews on human health monitoring arrangements For more information see: www.pesticides.gov.uk/pesticides_forum_home.asp Figure 5: Indicator - Consumer protection: Maximum Residues Levels compliance % of fruit and vegetable samples tested and found with one or more residues above the MRL % samples with residues above MRL 2005 2006 2007 2008 2009 2010 2011 10 9 8 7 6 5 4 3 2 1 0 All samples UK samples Other EC (non-UK) samples Source: Defra Expert Committee on Pesticide Residues in Food For more information see: www.pesticides.gov.uk/pesticides_forum_home.asp Non-EC samples Figure 6: Indicator - Human health protection: PIAP investigations Other complaints Alleged ill-health - unconfirmed 180 160 Number of incidents 140 120 100 80 60 40 20 0 Source: HSE Pesticide Incident Appraisal Panel Report 2011-12 For more information see: www.pesticides.gov.uk/pesticides_forum_home.asp Confirmed/likely/open Figure 7: Indicator - Pesticide poisoning incidents investigated by the Wildlife Incident Investigation Scheme (WIIS) 250 Abuse Misuse Approved use Unspecified use Veterinary compounds number of cases 200 150 100 50 0 * Numbers for 1995 refer to vertebrate incidents only . They do not not include bees, other invertebrates or fish. Source: CRD For more information see: www.pesticides.gov.uk/pesticides_forum_home.asp Part 4: Inspection of application equipment 5 For more information see: www.pesticides.gov.uk/pesticides_forum_home.asp Inspection of application equipment Many different deadlines • Certified equipment used from 2016. – 5 yearly tests until 2020, 3 yearly thereafter • Possible exemptions or differing arrangements for certain types of application equipment • Users to conduct regular calibrations and technical checks • Designation of bodies to conduct tests/certification systems • Mutual recognition of certificates For more information see: www.pesticides.gov.uk/pesticides_forum_home.asp R&D Assurance schemes Inspection of application equipment Regulation • Context Market supplies demand for annual testing of application equipment • Regulation New law requires all equipment to be tested in line with requirements of the directive. Also requires CRD to designate bodies to conduct inspections, keep a register of inspectors and grant certificates. Low-scale of use equipment to be inspected every 6 years. Derogation for knapsacks and handhelds. Professional users must carry out regular calibration checks • Non-regulatory measures Retailer protocols specify annual testing of equipment For more information see: www.pesticides.gov.uk/pesticides_forum_home.asp Figure 8: Indicator - User practice: National Sprayer Testing Scheme (NSTS) (number of sprayer tests and % sprayed area) 16,000 Tests % Sprayed area covered 14,000 100 90 80 12,000 10,000 8,000 6,000 60 50 40 30 4,000 20 2,000 0 Source: VI Annual Report 2010-11 and NSTS /AEA (2011/2012) For more information see: www.pesticides.gov.uk/pesticides_forum_home.asp 10 0 % sprayed area number of tests 70 Figure 9: Membership of crop assurance schemes on holdings sampled in the United Kingdom Pesticide Usage Survey Percentage of sampled area grown Percentage of holdings with crop assurance Orchards - 2008 (n = 170)1,2 Orchards - 2008 (n = 227)1 Fodder & forage crops - 2009 (n = 688)1 Edible protected crops - 2011 (n = 237) Outdoor vegetables- 2011 (n = 595) Soft fruit - 2010 (n = 275) Arable crops - 2010 (n = 544) n = number of farms surveyed 1 = Surveys of GB only 2 = Excluding holdings only growing cider apples 0 40 20 60 % Source: Pesticide Usage Survey For more information see: www.pesticides.gov.uk/pesticides_forum_home.asp 80 100 120 Part 5: Aerial application Indicators • 408 permits issued in 2012 For more information see: www.pesticides.gov.uk/pesticides_forum_home.asp Aerial spraying • Prohibited but derogation possible if conditions met • Designate authorities to set out conditions/ circumstances under which aerial spraying can be carried out • Designated authority to consider application plans and issue permits to spray • Monitoring to check compliance • Records to be kept and made available to the public For more information see: www.pesticides.gov.uk/pesticides_forum_home.asp R&D Assurance schemes Aerial spraying Regulation • Regulation Law allows CRD to issue permit to spray only when relevant conditions exist. Aviation legislation also regulates low-flying activities. Nature conservation legislation also relevant where CRD permits applications in or close to protected areas • Non-regulatory Aerial Application Association developing Operating Standards (best practice guide) For more information see: www.pesticides.gov.uk/pesticides_forum_home.asp Part 6: Measures to protect the aquatic environment and 6 drinking water For more information see: www.pesticides.gov.uk/pesticides_forum_home.asp Protection of the aquatic environment and drinking water • ‘Appropriate measures’ support Water Framework Directive • Give preference to particular products and application techniques • Use mitigation measures that minimise risk of off-site pollution – including buffer zones and safeguard zones • Minimise or eliminate applications on manmade surfaces with risk of run-off to water For more information see: www.pesticides.gov.uk/pesticides_forum_home.asp R&D Assurance schemes Regulation Protection of the aquatic environment and drinking water • Context Pesticide pollution of water means that UK may fail to meet requirements of Water Framework Directive. Good understanding of pesticides which most frequently pollute surface waters and groundwaters • Regulation Use of risk assessment and mitigation measures. Users to take ‘reasonable precautions’ to protect the environment, confine spray to target areas, minimise use in identified higher risk areas and give preference to particular product types. Also use of water legislation • Incentives Use of subsidies to encourage adoption of best practice measures • Non-regulatory Government and industry published guidance (Codes of Practice, Voluntary Initiative, Campaign for the Farmed Environment, Get Pelletwise, Amenity Forum), Catchment Sensitive Farming programme • Research and Development programme to improve – understanding of behaviour of pesticides once released into the environment; precision of spraying; and safe disposal practice For more information see: www.pesticides.gov.uk/pesticides_forum_home.asp Figure 10: Indicator - Surface water Drinking Water Protected Areas (DrWPAs) in England and Wales where assessments indicate pesticides are putting WFD Article 7 compliance at risk • 15% at risk of noncompliance – – – – – – – metaldehyde MCPA chlorotoluron mecoprop-P carbetamide 2,4-D propyzamide Source: Environment Agency For more information see: www.pesticides.gov.uk/pesticides_forum_home.asp Figure 14: Indicator – Groundwater bodies in England and Wales failing WFD objectives due to pesticides • 5% at risk of noncompliance – bentazone – mecoprop-P and 5 pesticides no longer available Source: Environment Agency For more information see: www.pesticides.gov.uk/pesticides_forum_home.asp Figure 16: Indicator - Number of substantiated category 1 and 2 pollution incidents for land, air or water, involving agricultural and non-agricultural pesticides Agricultural number of incidents 14 Non-agricultural 12 10 8 6 4 2 0 1999 2000 2001 2002 2003 2004 2005 2006 2007 2008 2009 2010 2011 Source: Environment Agency For more information see: www.pesticides.gov.uk/pesticides_forum_home.asp Part 7: Reduction of risk in specific areas 7 For more information see: www.pesticides.gov.uk/pesticides_forum_home.asp Reduction of use or risk in specific areas • Member states shall, taking account of hygiene, public health and biodiversity requirements, ensure use in minimised or prohibited in: a. areas used by the general public or vulnerable groups (parks, gardens, sports and recreation grounds, school grounds and children’s playgrounds and in the close vicinity of healthcare facilities) b. WFD protected areas or Natura 2000 sites c. recently treated areas accessible to agricultural workers • The use of low-risk products and biological control measures shall be considered in the first instance For more information see: www.pesticides.gov.uk/pesticides_forum_home.asp R&D Assurance schemes Reduction of use or risk in specific areas Regulation • Context 10% of all pesticide use in public spaces. Use in conservation areas also subject to conditions of nature protection legislation • Regulation Risk assessment process considers risk to public and workers in recently treated areas and imposes relevant mitigation measures (worker and human health protection legislation also relevant). Nature protection legislation imposes enhanced controls for sensitive sites • Non-regulatory Amenity Forum developing best practice guidance. Training providers launching NASOR and Amenity Assured • Research and Development into effectiveness and cost of integrated approaches For more information see: www.pesticides.gov.uk/pesticides_forum_home.asp Part 8: Handling and storage of pesticides & treatment of their packaging and remnants 7 For more information see: www.pesticides.gov.uk/pesticides_forum_home.asp Handling and storage • Adopt measures necessary to ensure the ensure following professional operations do not endanger human health or the environment a. b. c. d. e. • • storage, handling, dilution and mixing before application handling and packaging of remnants disposal of tank mixtures after application cleaning of equipment after application recovery or disposal of remnants and packaging in accordance with relevant waste legislation Storage areas constructed to ensure they prevent ‘unwanted releases Adopt measures to ensure non-professional users avoid dangerous handling operations (low-toxicity products, RTU, pack sizes) For more information see: www.pesticides.gov.uk/pesticides_forum_home.asp R&D Assurance schemes Handling and storage Regulation • Context Evidence suggests generally done to a high standard but some groups of users better than others • Regulation Risk assessment process identifies and mitigates risk (e.g. use closed transfer systems, container sizes, etc). Special requirements for authorisation of non-professional products. Legislation on use requires adoption of ‘reasonable precautions’ and construction of storage areas to prevent unwanted releases. Also legislation on pollution, waste, transport, accident hazards and building standards • Non-regulatory Government and industry guidance. Capital grants also available in Catchment Sensitive Farming Scheme for infrastructure investments. Pesticide Forum Container Management Group • Industry Voluntary Initiative promoting TOPPS guidance. BASIS store inspection scheme. Retailer protocols require adoption of relevant standards. Specific amenity and amateur guidance For more information see: www.pesticides.gov.uk/pesticides_forum_home.asp Figure 20: Indicator - User practice: Cross compliance checks, legislative breaches under SMR 9 and SMR 11 in 2011 number of inspections 2,500 2,000 1,500 1,000 500 0 England Scotland Inspections Wales Breaches Source: RPA inspection records For more information see: www.pesticides.gov.uk/pesticides_forum_home.asp Northern Ireland Figure 21: Variation in Cross Compliance Breach Rate (SMR 9 & SMR 11) between 2006 and 2011 10% 9% 8% % Breach Rate 7% 6% 5% 4% 3% 2% 1% 0% 2006 2007 England 2008 Scotland 2009 Wales 2010 Northern Ireland Source: RPA inspection records For more information see: www.pesticides.gov.uk/pesticides_forum_home.asp 2011 Figure 22: Comparison of number of cross compliance (SMR 9 and SMR 11) breaches and breach severity in 2011 number of breaches 80 70 60 50 40 30 20 10 0 England Scotland WL 1% Source: RPA inspection records 2% Wales 3% 5% >5% - 15% Northern Ireland >15% n%= % reduction of Single Payment Scheme claim WL = Warning letter For more information see: www.pesticides.gov.uk/pesticides_forum_home.asp Part 9: Integrated Pest Management (IPM) 7 For more information see: www.pesticides.gov.uk/pesticides_forum_home.asp Integrated Pest Management • Take measures to promote low-input pest management (IPM and organic farming) – giving priority to non-chemical methods • Establish and support establishment of conditions for implementation of IPM, ensuring users have information and tools to monitor pests and make decisions and access to advisory services • Report to the Commission on the way in which and how successful they have been, in meeting these requirements by 30 June 2013 • Describe in NAP how they will ensure general principles of IPM are implemented by users by 1 January 2014 • Establish appropriate incentives to encourage users to implement crop or sector specific IPM guidelines on voluntary basis. Guidelines can be drawn up by public bodies or user organisations For more information see: www.pesticides.gov.uk/pesticides_forum_home.asp R&D Assurance schemes Integrated Pest Management Regulation • Context Many users adopting elements of an integrated approach. Barriers to uptake are lack of quality and consistent level of control • Regulation Training programmes must cover integrated approaches. Biopesticides Scheme to support registration of products • Incentives Government support for farmers converting to organic production • Non-regulatory Retailer protocols promote practices consistent with the general principles of IPM. Particular guidance for Forestry • Research and Development Alternative approaches significant part of research programme For more information see: www.pesticides.gov.uk/pesticides_forum_home.asp IPM • • • • IPM = ICM (crop) = IFM (farm) What is the baseline? Sectoral needs vary IPM Plans – Agenda item October 2013 PF meeting – Check list – Greater encouragement – Site and season specific – Identify and monitor priorities at farm level For more information see: www.pesticides.gov.uk/pesticides_forum_home.asp Figure 23: Indicator - User practice: Crop Protection Management Plans (CPMPs) (area covered in hectares) Voluntary Initiative CPMP LEAF Audit 1,800,000 1,600,000 hectares 1,400,000 1,200,000 1,000,000 800,000 600,000 400,000 200,000 0 2003/4 2004/5 2005/6 Source: VI Annual Report 2011-12 2006/7 2007/8 2008/9 2009/10 2010/11 2011/12* (*2011/12 figure is CPMP/LEAF combined data) For more information see: www.pesticides.gov.uk/pesticides_forum_home.asp Figure 24: Indicator - Population of selected UK farmland bird species Corn Bunting Grey Partridge Yellowhammer 1.6 1.4 1.2 1.0 0.8 0.6 0.4 0.2 0.0 Source: Defra/British Trust for Ornithology/Joint Nature Conservation Committee/RSPB For more information see: www.pesticides.gov.uk/pesticides_forum_home.asp All Species (19) Figure 25: Indicator - Population of all UK bird species 1.6 Generalist farmland (7) All (122 spp) Specialists farmland (12) Wood (38 spp) Index (1970=1) 1.4 1.2 1.0 0.8 0.6 0.4 0.2 0.0 Source: Defra For more information see: www.pesticides.gov.uk/pesticides_forum_home.asp Farmland birds (19 spp) Seabirds (19 spp) Figure 26: Indicator – Cumulative numbers of active substances and products approved as biopesticides, in any one year 30 Active substances Products 25 20 15 10 5 0 1996 1997 1998 1999 2000 2001 2002 2003 2004 2005 2006 2007 2008 2009 2010 2011 2012 Source: HSE For more information see: www.pesticides.gov.uk/pesticides_forum_home.asp Figure 27: Comparison of number of biopesticides (active substances) registered in each EU member state according to the UK definition of a biopesticide (as at May 2012) 50 Pheromone 45 Microbials & plant extracts 40 35 30 25 20 15 10 Source: EU Pesticides Database, 2012 For more information see: www.pesticides.gov.uk/pesticides_forum_home.asp France Spain Netherlands Italy United Kingdom Belgium Sweden Slovenia Germany Luxembourg Greece Finland Denmark Ireland Cyprus Hungary Bulgaria Austria Poland Czech Slovakia Portugal Estonia Lithuania Latvia Romania 0 Malta 5 Figure 28: Total number of active substances authorised* for use on plum crops, by type (*on-label and SOLA/EAMU) 50 45 40 35 2 4 2 1 30 25 3 2 13 soil sterilant Plant Growth Regulator (PGR) fungicides 12 6 5 16 13 12 2005 2010 0 1995 vertebrate control molluscicides 13 6 13 1 3 3 2 insecticides 15 10 5 2 4 15 20 15 2 4 2 2 2000 Year Notes: 1995: 1 herbicide only available as SOLA/EAMU 2000: 1 fungicide, 1 herbicide, 1 insecticide only available as SOLA/EAMU 2005: 3 fungicides, 1 herbicide, 4 insecticides, 1 PGR only available as SOLA/EAMU 2010: 7 fungicides, 2 herbicides, 4 insecticides, 1 PGR only available as SOLA/EAMU. Source: HSE For more information see: www.pesticides.gov.uk/pesticides_forum_home.asp herbicides Figure 29: Total number of active substances authorised to control blossom wilt, plum fruit moth and perennial broad-leaved weeds in plum crops (on-label and SOLA/EAMU) blossom wilt plum fruit moth perennial broad-leaved weeds 14 12 1 10 8 1 4 1 6 4 7 1 6 4 2 0 1 1 1995 2000 7 1 Year 2005* 2010** Notes: 2005*: the fungicide authorised for blossom wilt control is only available as a SOLA/EAMU 2010**: 5 out of the 7 fungicides authorised for blossom wilt control are only available as SOLAs/EAMUs Source: HSE For more information see: www.pesticides.gov.uk/pesticides_forum_home.asp Figure 30: Indicator – Pesticide Availability - Total number of active substances authorised* for use on winter oilseed rape crops, by type (*on-label and SOLA/EAMU) 90 vertebrate control 80 soil sterilant 3 3 70 2 3 2 60 pheromone 3 3 2 3 food storage 4 molluscicide 2 2 2 3 Plant Growth Regulator (PGR) 4 21 50 2 16 17 12 insecticide fungicide 40 herbicide 20 18 24 24 1995 2000 30 19 21 20 10 22 23 2005 2010 0 Source: HSE Year Notes: Active substances not used by growers: 1995: 4 herbicides, 5 insecticides, 1 PGR, 3 soil sterilants 2000: 2 herbicides, 3 insecticides, 1 PGR, 3 soil sterilants 2005: 1 fungicide, 1 insecticide, 1 molluscicide, 3 soil sterilants; 1 herbicide only available as SOLA/EAMU 2010: 2 fungicides, 1 herbicide, 2 insecticides, 1 molluscicide, 2 soil sterilants, 1 vertebrate control agent; 2 herbicides only available as SOLA/EAMU For more information see: www.pesticides.gov.uk/pesticides_forum_home.asp Figure 31: Indicator - Pesticide Availability – Total number of active substances authorised* to control phoma canker, cabbage stem flea beetle and cleavers in winter oilseed rape crops (*on-label and SOLA/EAMU) 50 45 40 35 30 25 20 15 10 5 0 11 12 14 11 cleavers cabbage stem flea beetle 20 17 13 15 13 14 16 16 1995 2000 2005 2010 phoma canker Year Source: HSE Notes: 2005: one herbicide authorised for cleaver control is only available as SOLA/EAMU 2010: one herbicide authorised for cleaver control is only available as SOLA/EAMU See Figure 32 for numbers of active substances used by growers against the target pests. For more information see: www.pesticides.gov.uk/pesticides_forum_home.asp Figure 32: Total number of active substances (probably) used by growers to control phoma canker, cabbage stem flea beetle and cleavers in winter oilseed rape crops (on-label and SOLA/EAMU) 40 35 30 6 25 11 8 9 cleavers 20 15 14 13 10 11 10 12 cabbage stem flea beetle phoma canker 10 5 0 1995 2000 Year 13 13 2005 2010 Notes: For 2005 and 2010: one herbicide authorised for cleaver control is only available as SOLA/EAMU Source: HSE For more information see: www.pesticides.gov.uk/pesticides_forum_home.asp Part 10: Indicators 10 For more information see: www.pesticides.gov.uk/pesticides_forum_home.asp Indicators • Member States shall: calculate the harmonised risk indicators using the sales and usage data collected under the statistics regulation; identify trends in the use of certain active substances; identify substances, crops, regions or practices that require attention or are examples of good practice • Member states shall communicate the results of these evaluations to the Commission For more information see: www.pesticides.gov.uk/pesticides_forum_home.asp R&D Assurance schemes Indicators Regulation • Context Sophisticated and long-standing suite of indicators prepared by Pesticides Forum. Awaiting development of EU HAIR indicators • Regulatory measures Collection of pesticide usage and sales data. Food residue monitoring programme. Number of human health monitoring surveys (being reviewed) • Non-regulatory Wildlife Incident monitoring schemes • Research and development Pest, weed and disease survey reports For more information see: www.pesticides.gov.uk/pesticides_forum_home.asp Figure 36: Indicator – Pesticide Usage Estimated annual usage for all crops in Great Britain (tonnes of active substance applied) 25,000 Tonnes of active substance applied 20,000 15,000 10,000 5,000 0 1995 1996 1997 1998 1999 2000 2001 2002 2003 2004 2005 2006 2007 2008 2009 2010*2011* Source: Food & Environment Research Agency (FERA) Pesticides Usage Survey N.B. Totals exclude sulphuric acid. * figures include Northern Ireland For more information see: www.pesticides.gov.uk/pesticides_forum_home.asp Key Issues and Pesticide Use- Arable Crops Pest, disease, weed incidence in 2011/12 Crop Major pest, disease or weed Incidence Impact on pesticide use Winter wheat Septoria Increased use of SDHI fungicides & increased rates. Winter Wheat Fusarium ear blight & Microdochium ear blight Increased use of T3 ear wash sprays. Seed treatment expected to increase for 2013. Winter wheat & barley Aphids = Increased BYDV in 2012 which could result in increased insecticide use in 2013 Winter wheat Black-grass = Increased resistance Oilseed rape Sclerotinia = Key: Source: ADAS Notable changes in pesticide use = Large increase Small increase Normal Small decrease Large decrease See http://www.pesticides.gov.uk/guidance/industries/pesticides/topics/about-pesticides/pest-disease-and-weed-incidence-information For more information see: www.pesticides.gov.uk/pesticides_forum_home.asp Key Issues and Pesticide Use- Arable Crops II Pest, disease, weed incidence in 2011/12 Crop Major pest, disease or weed Incidence Impact on pesticide use Potato Late blight Potato Storage diseases = Oilseed rape Sclerotinia = Oilseed rape Light leaf Spot = Maize Eyespot Key: Source: ADAS Notable changes in pesticide use Number of sprays increased (from 10 per crop) as newer, more aggressive disease strains develop. Recommendation that MBC, SDHI and strobilurins are not used more than once on their own = Large increase Small increase Normal Small decrease Large decrease See http://www.pesticides.gov.uk/guidance/industries/pesticides/topics/about-pesticides/pest-disease-and-weed-incidence-information For more information see: www.pesticides.gov.uk/pesticides_forum_home.asp Key Issues and Pesticide Use- Horticulture Crops Pest, disease, weed incidence in 2011/12 Crop Major pest, disease or weed Incidence Impact on pesticide use Notable changes in pesticide use Soft Fruit (strawberry) Slugs High levels in the summer resulted in increased molluscicide use. Strawberry Redcore Fosetyl-aluminium (Aliette) until stocks ran out then switched to the newly introduced fenamidone + fosetylaluminium (fenomenal) Apple Apple scab More sprays at poor timings due to weather issues. Carrot All disease = Protectant sprays used therefore application occurs before symptoms Onion Downy Mildew Increased use of Unicur and Valbon due to short harvest intervals Key: Source: ADAS = Large increase Small increase Normal Small decrease Large decrease See http://www.pesticides.gov.uk/guidance/industries/pesticides/topics/about-pesticides/pest-disease-and-weed-incidence-information For more information see: www.pesticides.gov.uk/pesticides_forum_home.asp Figure 37: Indicator - Cropped areas (in hectares) in the UK 7000000 Set-aside 6000000 Temporary grass (< 5 years) 5000000 Crops for stockfeeding hectares Other crops not for stockfeed 4000000 Horticulture Pulses 3000000 Potatoes Sugar beet 2000000 Oilseeds Other cereals 1000000 Spring barley Winter barley 2012 2011 2010 2009 2008 2007 2006 2005 2004 2003 2002 2001 0 Source: Defra UK June Agricultural Survey 2012, Welsh Government For more information see: www.pesticides.gov.uk/pesticides_forum_home.asp Wheat Figure 38: Indicator - Pesticide average inputs per crop (kg active substance applied per hectare grown) in the UK kg active substance applied per hectare grown including soil sterilants Herbicides Fungicides Insecticides Growth regulators Molluscicides Soil sterilants 60 50 40 30 20 10 0 Source: Pesticides Usage Survey Surveys are not conducted annually for all crops. The most recent year of data availability is shown against each crop. *Figures relate to GB usage only, other figures are for UK usage For more information see: www.pesticides.gov.uk/pesticides_forum_home.asp Figure 39: Indicator - Pesticide average inputs per crop (kg active substance applied per hectare grown) in the UK kg active substance applied per hectare grown excluding soil sterilants Herbicides Fungicides Insecticides Growth regulators Molluscicides 18 16 14 12 10 8 6 4 2 0 Source: Pesticides Usage Survey Surveys are not conducted annually for all crops. The most recent year of data availability is shown against each crop. *Figures relate to GB usage only, other figures are for UK usage For more information see: www.pesticides.gov.uk/pesticides_forum_home.asp Figure 40: Indicator – Pesticide average inputs for oilseed rape (kg active substance applied per hectare grown) in Great Britain kg active substance applied per hectare grown Herbicides Fungicides Insecticides Growth regulators Molluscicides Seed treatments 3.5 3.0 2.5 2.0 1.5 1.0 0.5 0.0 1996 1998 2000 2002 2004 Source: Pesticides Usage Survey For more information see: www.pesticides.gov.uk/pesticides_forum_home.asp 2006 2008 2010 Figure 41: Indicator - Herbicide use on oilseed rape (number of products and total doses of active substances per hectare) Average total dose (kg a.s.) applied per hectare Average number of products per hectare Average dose (full label units) applied per hectare kg active substance per hectare 4.5 4.0 3.5 3.0 2.5 2.0 1.5 1.0 0.5 0.0 2000 2002 2004 2006 Source: Pesticides Usage Survey For more information see: www.pesticides.gov.uk/pesticides_forum_home.asp 2008 2010 Figure 42: Indicator - Insecticide use on oilseed rape (number of products and total doses of active substances per hectare) Average total dose (kg a.s.) applied per hectare Average number of products per hectare Average dose (full label units) applied per hectare kg active substance per hectare 2.0 1.8 1.6 1.4 1.2 1.0 0.8 0.6 0.4 0.2 0.0 2000 Source: Pesticides Usage Survey 2002 2004 2006 For more information see: www.pesticides.gov.uk/pesticides_forum_home.asp 2008 2010 Summary and future plans 10 For more information see: www.pesticides.gov.uk/pesticides_forum_home.asp Summary - usage • Use of pesticides not impacting adversely UK health or environment – statutory and voluntary controls effective, but – scope to reduce risks further • Pesticide usage affected by season, product availability, resistance, commodity prices – continued decline in use of active substance – application technology continues to improve precision of application • Training of pesticide users increasing – 85% sprayed area are NRoSO members – improvements in Amenity and for garden centre staff For more information see: www.pesticides.gov.uk/pesticides_forum_home.asp Summary – future plans • Continue to meet challenge of securing food supply • Continue to encourage best practice • Implementation of National Action Plan (NAP) – Pesticides Forum is principal stakeholder group – Implementation of Sustainable Use Directive (SUD) – Promotion of IPM/Integrated Crop Management (ICM) • Short-life working groups and expert contributions – specific topics identified by Government or stakeholders – report back to Pesticides Forum • Indicators – To further align with SUD and NAP For more information see: www.pesticides.gov.uk/pesticides_forum_home.asp Priorities for 2012/13 • Protecting water – Metaldehyde, oilseed rape herbicides • Improving standards in non-agricultural sectors – Amenity; home and garden • Promotion of IPM Pesticides Forum will work with member organisations and other stakeholders to help further reduce the risk to human health and the environment For more information see: www.pesticides.gov.uk/pesticides_forum_home.asp Acknowledgements • Member Organisations of the Pesticides Forum and many others – provide data and analysis used in Indicators For more information see: www.pesticides.gov.uk/pesticides_forum_home.asp
