Chapter 7 - Managing Quality
advertisement
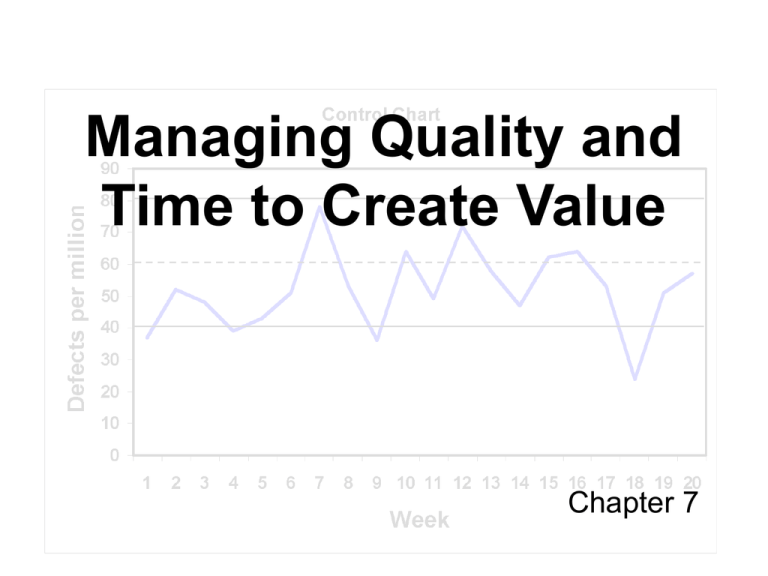
Managing Quality and Time to Create Value Chapter 7 How much quality is enough? Total quality management (TQM) Continuous improvement toward perfection Assumes customers seek high quality and will pay for it Return on quality (ROQ) Tradeoff between costs and benefits of quality Maximize profit instead of quality Costs of quality Prevention costs Cost incurred to prevent a problem Design, process improvement, training, etc. Appraisal costs Cost incurred to identify problems Inspection, testing, evaluations, etc. Costs of quality Internal failure costs Costs incurred to correct problems while still in the company’s control Rework, scrap, retesting, delays, etc. External failure costs Costs incurred to correct problems after the problem leaves the company’s control Warranty repairs, replacement, recalls, lawsuits, damage to reputation, lost sales, etc. Costs of quality In theory: Spending on prevention reduces appraisal and failure costs Spending on appraisal reduces external failure costs ROQ is maximized where combined cost is minimized Quality cost tradeoff 120 100 Cost 80 60 40 20 0 1 2 3 4 5 6 7 8 9 10 11 12 13 14 15 Problems Failure cost Prevention/appraisal cost Total quality cost Tracking quality Indicators Frequency distributions Run chart Control chart Diagnostics Scatter diagrams Cause and effect diagrams/flowcharts Pareto charts Time matters Time is the one resource you cannot buy Speed is a competitive advantage Product/service development time Customer response time Receipt of order to delivery Production cycle time Start to completion of production process Time/efficiency measures Productivity Outputs / inputs Cycle time Total processing time / good output produced Throughput efficiency Value-added time / Total processing time Measuring capacity Theoretical (rated) capacity -- Planned downtime = Practical capacity -- Capacity used to meet demand = Excess capacity Time-based ABC Simpler version of traditional ABC Time used as driver base Calculation of driver rate Cost of capacity to provide service Time available to complete service Cost = time required * driver rate Just-in-time systems Traditional “push” system Prepare sales forecast Order components Receive customer order Produce inventory Ship from inventory or produce Results in mismatch between supply and demand Excess inventory or lost sales Just-in-time systems JIT “pull” system Receive customer order Schedule production Produce customer's order Order components Ship to customer Better match between supply and demand Less inventory Possibly slower response Just-in-time systems Requirements of JIT Flexible capacity and workforce Smooth production flow Short cycle times and processing times Reliable suppliers Commitment to quality

![Just In TimebySteveSpangler[1]](http://s2.studylib.net/store/data/015258223_1-6dc0b9ee782adffcd2f1156437c2a291-300x300.png)
