RISKMAP presentation - CRUE Flooding Era-Net
advertisement
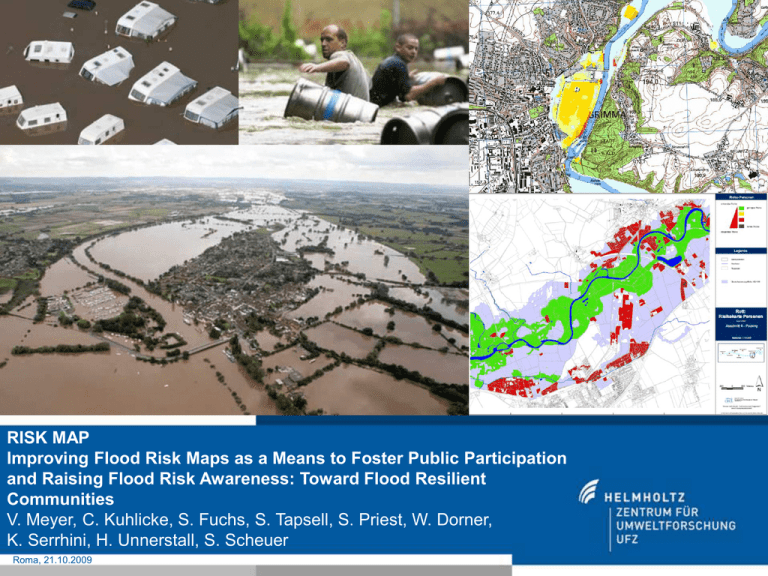
RISK MAP Improving Flood Risk Maps as a Means to Foster Public Participation and Raising Flood Risk Awareness: Toward Flood Resilient Communities V. Meyer, C. Kuhlicke, S. Fuchs, S. Tapsell, S. Priest, W. Dorner, K. Serrhini, H. Unnerstall, S. Scheuer Roma, 21.10.2009 Introduction “How can flood hazard and risk maps be improved as an instrument of risk communication? How can data from hazard and vulnerability analyses be used to initiate a public dialogue?“ (ERA-Net CRUE 2nd Common Call) Shortcomings in practice of risk mapping 1. Top-down risk communication: The public is only seen as a receiver of information no involvement in the risk mapping process 2. Risk maps (if existing at all) focus on economic damages: social and environmental effects are often neglected 3. Complex visualisation: risk maps often cannot be easily understood by laypersons not suitable for the respective needs of public authorities in risk and event management Objectives of RISK MAP Improving risk communication by means of risk maps: 1. Developing of appropriate stakeholder participation processes incorporation of local knowledge and preferences foster communication and risk awareness 2. Improving the content of risk maps by considering social, economic and environmental risks participative multicriteria risk mapping tool 3. Improving the visualisation of risk maps in order to produce user-friendly risk maps experimental graphic semiology: eye-tracking approach recommendations on visualisation RISK MAP Team BOKU – University of Natural Resources and Applied Life Sciences (Wien, Austria) Sven Fuchs FHD - University of Applied Science Deggendorf (Germany) RISKCATCH Wolfgang Dorner Université François-Rabelais Tours, EPU’DA, UMR CNRS 6173 CITERES (France) Kamal Serrhini Flood Hazard Research Center, Middlesex University (UK) Sue Tapsell, Sally Priest UFZ – Helmholtz Centre for Environmental Research (Leipzig, Germany): C. Kuhlicke, H. Unnerstall, J. Luther, S. Scheuer, V. Meyer (Coordination) FLOODsite FLOOD-ERA TEAM: • UFZ (Leipzig, Germany) • FHRC - Flood Hazard Research Centre (UK) • BOKU Wien (Austria) • FH Deggendorf (Germany) • Univ. Francois-Rabelais Tours, CNRS (France) Structure of RISK MAP WP 2 WP 3 Status quo in the case studies Improving risk maps Recommendations Task 2.1 Participation Task 2.3 Visualisation (FHRC) (BOKU) Task 2.2 Multicriteria risk mapping tool Task 2.4 Graphic Semiology (UFZ) (U Tours) Task 3.1 Validation, Common recommendations (UFZ) Task 1.2 Current practice (FHD) Task 1.1 Legal framework (UFZ) Results from RISKCATCH, FLOODsite, FLOOD-ERA WP 1 WP 4: Case studies Austria (BOKU) England (FHRC) Saxony (UFZ) Bavaria (FHD) TEAM: • UFZ (Leipzig, Germany) • FHRC - Flood Hazard Research Centre (UK) • BOKU Wien (Austria) • FH Deggendorf (Germany) • Univ. Francois-Rabelais Tours, CNRS (France) Structure of RISK MAP WP 2 WP 3 Status quo in the case studies Improving risk maps Recommendations Task 2.1 Participation Task 2.3 Visualisation (FHRC) (BOKU) Task 2.2 Multicriteria risk mapping tool Task 2.4 Graphic Semiology (UFZ) (U Tours) Task 3.1 Validation, Common recommendations (UFZ) Task 1.2 Current practice (FHD) Task 1.1 Legal framework (UFZ) Results from RISKCATCH, FLOODsite, FLOOD-ERA WP 1 WP 4: Case studies Austria (BOKU) England (FHRC) Saxony (UFZ) Bavaria (FHD) Task 2.2: Multicriteria risk mapping tool Objective Improving the content of risk maps Enhancing a multicriteria risk mapping tool Stakeholder participation Approach Multicriteria risk mapping approach… Economic: annual average damage Multicriteria risk mapping: aggregation of different risk criteria maps Environmental: erosion, accumulation of polluted material, biotopes Population: annual affected population social hot spots: hospitals, schools, … Innovation in RISK MAP: Participation (⇒ Task 2.1): Selection of criteria Weighting of criteria Improved visualisation (⇒ Task 2.3) Semantic modelling approach Depict local knowledge Define advanced rules for risk calculation Expected outcomes exemplary weighting - economic: 0.4 - population: 0.4 - soc. hot spots: 0.1 - environmental: 0.1 Participative multicriteria risk mapping tool Meyer, Haase & Scheuer 2009 TEAM: • UFZ (Leipzig, Germany) • FHRC - Flood Hazard Research Centre (UK) • BOKU Wien (Austria) • FH Deggendorf (Germany) • Univ. Francois-Rabelais Tours, CNRS (France) Structure of RISK MAP WP 2 WP 3 Status quo in the case studies Improving risk maps Recommendations Task 2.1 Participation Task 2.3 Visualisation (FHRC) (BOKU) Task 2.2 Multicriteria risk mapping tool Task 2.4 Graphic Semiology (UFZ) (U Tours) Task 3.1 Validation, Common recommendations (UFZ) Task 1.2 Current practice (FHD) Task 1.1 Legal framework (UFZ) Results from RISKCATCH, FLOODsite, FLOOD-ERA WP 1 WP 4: Case studies Austria (BOKU) England (FHRC) Saxony (UFZ) Bavaria (FHD) Task 2.1: Participation Objective Approach/Methods to create a participatory framework that allows integration of selected stakeholders in the risk mapping process: their information requirements and local expertise Differentiation of stakeholder groups (decision-makers, experts, civil society and local population), Literature review on participation Interviews & series of workshops Expected outcomes Recommendation for stakeholder participation in the risk mapping process TEAM: • UFZ (Leipzig, Germany) • FHRC - Flood Hazard Research Centre (UK) • BOKU Wien (Austria) • FH Deggendorf (Germany) • Univ. Francois-Rabelais Tours, CNRS (France) Structure of RISK MAP WP 2 WP 3 Status quo in the case studies Improving risk maps Recommendations Task 2.1 Participation Task 2.3 Visualisation (FHRC) (BOKU) Task 2.2 Multicriteria risk mapping tool Task 2.4 Exp. Graphic Semiology (UFZ) (U Tours) Task 3.1 Validation, Common recommendations (UFZ) Task 1.2 Current practice (FHD) Task 1.1 Legal framework (UFZ) Results from RISKCATCH, FLOODsite, FLOOD-ERA WP 1 WP 4: Case studies Austria (BOKU) England (FHRC) Saxony (UFZ) Bavaria (FHD) Task 2.3 & 2.4: Visualisation & Experimental Graphic Semiology Objective To develop improved recommendations for risk visualisation in risk maps Approach/Methods Based on participative approach (Task 2.1) Interviews with different stakeholders GIS-based compilation of a set of different maps: ⇒ Scale, size, content, colours used,… ⇒ based on results of RISKCATCH… Test of maps by using the method of experimental graphic semiology… Title: in top and not too far away from the legend Background of map: of clear and “realistic” color Legend: - With + - Contrast between informative elements and background 5 classes, - Range of only one color, - In red - In order of decreasing value - and written sufficiently large Additional information of limited number Scale 1/2500, preferably graphical Experimental Graphic Semiology 1) Different maps… (⇒ Task 2.3) 2) Presentation (15 s) of maps to stakeholders Innovation in RISK MAP: 3) Cognitive survey More test persons Different stakeholder groups New test sites pre- and post-questionnaire Multicriteria Maps (⇒Task 2.2) 4) Eye movements: (statistic, dynamic, spatial analysis) Expected outcomes (Task 2.3 & 2.4) Recommendations of how information can be delivered target-oriented… Fuchs, Dorner, Sprachinger & Serrhini 2007 Structure of RISK MAP 2 3 4 WP 2 WP 3 Status quo in the case studies Improving risk maps Recommendations Task 2.1 Participation Task 2.3 Visualisation (FHRC) (BOKU) Task 2.2 Multicriteria risk mapping tool Task 2.4 Graphic Semiology (UFZ) (U Tours) Task 3.1 Validation, Common recommendations (UFZ) Task 1.2 Current practice (FHD) Task 1.1 Legal framework (UFZ) Results from RISKCATCH, FLOODsite, FLOOD-ERA WP 1 WP 4: Case studies 1 Austria (BOKU) Wartschenbach & Vorderbergerbach 2 England (FHRC) Lower Thames 3 Saxony (UFZ) Vereinigte Mulde 4 Bavaria (FHD) Vills & Rott 1 Time schedule in the case studies 1. Stakeholder Workshop Status quo in the case studies • legal framework • interviews Month 1 6 9/2009 12 9/2010 Stakeholder involvement Enhancement of risk maps • additional criteria • visualisation interviews 2 workshops eye-tracking tests Eyetracking tests 2. Stakeholder Workshop Final phase: • update risk maps • recommendations 18 24 9/2011 Expected results of RISK MAP Improved risk maps… exemplary risk maps in the case studies Recommendations on how to… organize participation in risk mapping improve the content of risk maps improve the visualisation of risk maps Limitations of risk maps Dissemination Local & regional stakeholders: Direct involvement during & after the project Science & policy audience Conference presentations Journal articles (national and international) Stakeholder & scientific Network (EU-projects CapHaz-Net & ConHaz) Wider audience Project reports web-page (www.risk-map.org) Thank you very much for your attention! RISK MAP Improving Flood Risk Maps as a Means to Foster Public Participation and Raising Flood Risk Awareness: Toward Flood Resilient Communities V. Meyer, C. Kuhlicke, S. Fuchs, S. Tapsell, S. Priest, W. Dorner, K. Serrhini, H. Unnerstall, S. Scheuer

