Behavioral Finance - American Economic Association
advertisement
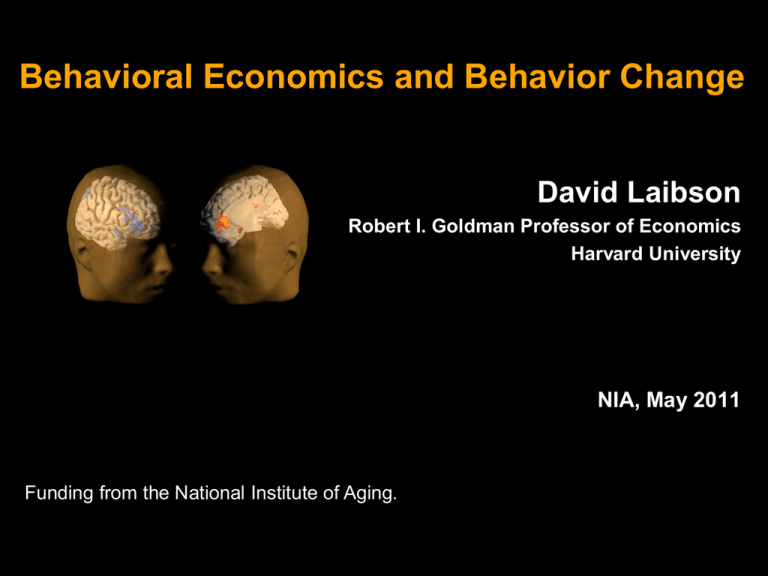
Behavioral Economics and Behavior Change David Laibson Robert I. Goldman Professor of Economics Harvard University NIA, May 2011 Funding from the National Institute of Aging. Pension coverage by type of pension plan among all private sector workers in US 35% Defined Contribution Only 30% 25% 20% Both 15% 10% Defined Benefit Only 0% 2 1979 1980 1981 1982 1983 1984 1985 1986 1987 1988 1989 1990 1991 1992 1993 1994 1995 1996 1997 1998 1999 2000 2001 2002 2003 2004 2005 2006 2007 2008 5% Source: EBRI and Department of Labor $100 bills on the sidewalk Choi, Laibson, Madrian (2010) In 401(k)’s, employer match is a risk-free high return 401(k) is particularly appealing if you are over 59½ – Can withdraw money without penalty We study seven companies and find that on average, half of employees over 59½ are taking full advantage of their employer match – Average loss is 1.6% of salary per year Educational intervention has no effect 3 Households are retiring with very little financial wealth HRS (65-69): In 2008, the median holding of financial assets is $12,500 among 1-person households HRS (65-69): In 2008, the median holding of financial assets is $111,600 among 2-person households 4 Source: Venti, Poterba, and Wise 2011 “If 5 people all have the winning numbers in the lottery and the prize is two million dollars, how much will each of them get?” Fraction of people who answer “400,000” Source: HRS; Agarwal, Driscoll, Gabaix, Laibson (2009) Middle-income retirees are in trouble Social Security replaces less than ½ of their income. DB pensions are vanishing. The median household retires with $200,000 of nonannuitized wealth, most of which is home equity. OOP health care costs are expected to consume $300,000+ for a two-person household. These OOP estimates are rising about 10% per year. Do Americans understand the problem? 8 Procrastination in retirement savings Choi, Laibson, Madrian, Metrick (2002) Survey – Mailed to a random sample of employees – Matched to administrative data on actual savings behavior Typical breakdown among 100 employees Out of every 100 surveyed employees 68 self-report saving too little 24 plan to raise savings rate in next 2 months 3 actually follow through 10 Do people want to tie themselves to the mast? Beshears, Choi, Laibson, Madrian, Sakong (2010) (cf. Ashraf and Karlan 2004) Give subjects a budget ($50, $100, or $500) and ask them to allocate between: – Freedom account (22% interest) – Commitment account (22% interest): restrictions on withdrawal before self-selected goal date, about 100 days in the future Economically speaking, the Freedom account dominates the Commitment account (Freedom account has greater liquidity) Proportion invested in commitment account Beshears, Choi, Laibson, Madrian, Sakong (2010) 0.6 0.5 0.4 0.3 0.2 0.1 0 No withdrawal 10% penalty 20% penalty Nature of early withdrawal rule in the illiquid account We don’t know how to contain health care costs, but we do know how to raise savings. 13 Defaults Automatic enrollment An example: Welcome to the company If you don’t do anything –You are automatically enrolled in the 401(k) –You save 2% of your pay –Your contributions go into a default fund Call this phone number to opt out of enrollment or change your investment allocations Madrian and Shea (2001) Choi, Laibson, Madrian, Metrick (2004) 401(k) participation by tenure at firm 100% Automatic enrollment 80% 60% Standard enrollment 40% 20% 0% 0 6 12 18 24 30 36 Tenure at company (months) 42 48 Do workers like automatic enrollment? In firms with standard 401(k) plans (no auto-enrollment), 2/3 of workers say that they should save more Opt-out rates under automatic enrollment are typically only 10% (opt-out rates rarely exceed 15%) Under automatic enrollment HR reports “no complaints” 97% of employees in auto-enrollment firms approve of auto-enrollment Even among the subset of workers who opt out of automatic enrollment, approval is 79% The US government just adopted automatic enrollment 16 Opt-in enrollment Opt-out enrollment (auto-enrollment) PROCRASTINATION UNDESIRED BEHAVIOR: Non-participation START HERE DESIRED BEHAVIOR: participation Choice-based regimes: Active decisions Choi, Laibson, Madrian, Metrick (2010) Active decision mechanisms require employees to make an active choice about 401(k) participation. Welcome to the company You are required to submit this form within 30 days of hire, regardless of your 401(k) participation choice If you don’t want to participate, indicate that decision If you want to participate, indicate your contribution rate and asset allocation Being passive is not an option 401(k) participation increases under active decisions 401(k) participation by tenure 100% Active decision 80% Standard enrollment 60% 40% 20% 0% 0 6 12 18 24 30 36 42 Tenure at company (months) 48 54 Active Choice PROCRASTINATION UNDESIRED BEHAVIOR: Must choose for oneself Non-participation START HERE DESIRED BEHAVIOR: participation Simplified enrollment raises participation Fraction Ever Participating in Plan Beshears, Choi, Laibson, Madrian (2006) 50% 2005 2004 40% 30% 2003 20% 10% 0% 0 3 6 9 12 15 18 21 24 27 30 33 Time since baseline (months) 21 Quick enrollment PROCRASTINATION UNDESIRED BEHAVIOR: Non-participation START HERE DESIRED BEHAVIOR: participation Quick enrollment PROCRASTINATION UNDESIRED BEHAVIOR: Non-participation START HERE DESIRED BEHAVIOR: participation Improving participation in 401K plans (for a typical firm) Default non-enrollment 40% (financial incentives alone) Quick Enrollment 50% (“check a box”) Active choice 70% (perceived req’t to choose) Default enrollment 90% (opt out) 0% 20% 40% 60% 80% 100% Participation Rate (1 year of tenure) 24 Research Impact: Savings Policy Motivation behind the “Autosave” features of the Pension Protection Act of 2006 – Regulations contain numerous footnotes to NIA- research. Motivation behind the “Auto IRA” proposal currently under legislative consideration Kiwisaver plan in New Zealand Pensions reform in the U.K. Myriad other financial reforms across the world. Research Impact: Employer-Sponsored Savings Plans Representing 43% of employees at firms with 401(k) plans Emotional system (dopamine reward system) vs. Fronto-Parietal System Frontal cortex Dopaminergic Reward Systems 27 Parietal cortex Neural mechanisms Stay on your diet (dLPFC) I want a donut (dopamine reward system) McClure, Laibson, Loewenstein, Cohen (2004) McClure, Ericson, Laibson, Loewenstein, Cohen (2007) Hare, Camerer, Rangel (2009) Figner, Knoch, Johnson, Krosch, Lisanby, Fehr, Weber (2010) McClure, Laibson, Loewenstein, and Cohen Science (2004) Emotional system responds only to immediate rewards 7 T13 0 Neural activity x = -4mm 29 VStr y = 8mm MOFC z = -4mm MPFC PCC Seconds = Earliest reward available today = Earliest reward available in 2 weeks = Earliest reward available in 1 month 0.4% 2s Analytic brain responds equally to all rewards VCtx PMA RPar DLPFC VLPFC LOFC x = 44mm 0.4% 2s x = 0mm 0 30 T13 15 = Earliest reward available today = Earliest reward available in 2 weeks = Earliest reward available in 1 month Brain Activity in the Frontal System and Emotional System Predicts Behavior Brain Activity McClure, Laibson, Loewenstein, Cohen (2004) Frontal system 0.05 0.0 Emotional System -0.05 Choose Smaller Immediate Reward 31 Choose Larger Delayed Reward Conceptual Summary Practical solutions that lead to behavior change Principal application: retirement savings Neuroeconomic foundations 32 Translation to the health domain Similarities with saving behavior: Employees and employers have many aligned goals – Improve employee health and control costs Employees want behavior change (just not right now) – Improve diet – Increase physical activity – Stop smoking – Adhere to therapeutic recommendations 33 Translation to the health domain Similarities with saving behavior: Employees have a hard time aligning their good intentions and their actions When costs precede benefits, decision-makers fail 34 Example of an effective free intervention: flu shot communication Control: normal (informational) mailing Treatment 1: normal mailing + make a date plan Treatment 2: normal mailing + make a date/time plan 36 Ask employees to make a precise plan Milkman, Beshears, Choi, Laibson, and Madrian (forthcoming 2011, Proceedings of the National Academy of Sciences; under embargo until publication) 38% 37% 36% 35% 34% 33% 32% 31% 37 Flu shot1 letter 2 Flu shot letter + date plan Flu shot3 letter + date plan + time plan Use Active Choice to encourage adoption of Home Delivery of chronic medication Beshears, Choi, Laibson, and Madrian (in preparation) • • • • • • • Voluntary No plan design change Lower employee co-pay Time saving for employee Lower employer cost Better medication adherence Improved safety Member Express Scripts Scientific Advisory Board (All payments donated to charity.) 38 Preliminary results from pilot study on 54,863 employees without home delivery taking chronic medication Among those making an active choice: Fraction choosing home delivery: 52.2% Fraction choosing standard pharmacy pick-up: 47.8% Preliminary results from pilot study at one company Rxs by Mail* 350,000 After 300,000 Annual Savings 250,000 200,000 Plan $2,413,641 150,000 Members $1,872,263 100,000 50,000 0 * Annualized Before Total Savings $4,285,904 Summary Behavioral economics explains why people often fail to act in their own best interest Key problem – costs come early and benefits come late Self-defeating behavior can be changed using inexpensive, scalable interventions Defaults and other nudges have worked in the 401(k) domain The same concepts are now being applied in the health domain 41
