P&L responsibility for all Amtrak Long Distance services
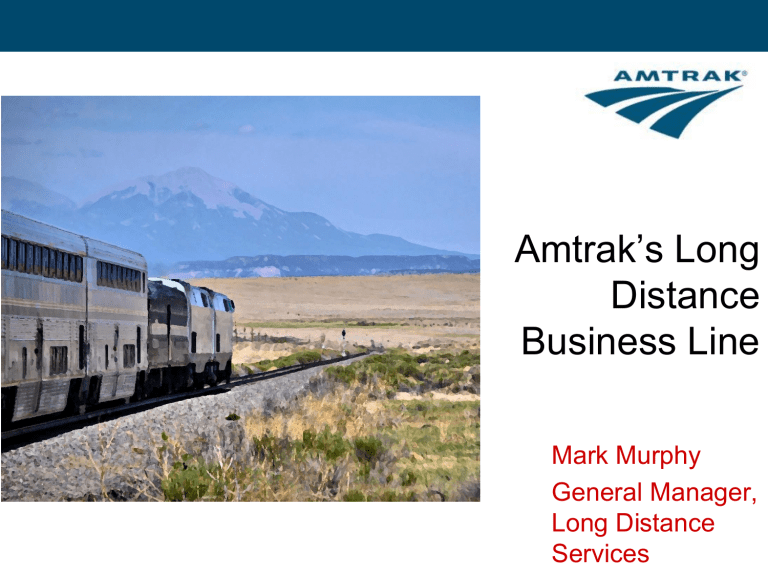
Amtrak’s Long
Distance
Business Line
Mark Murphy
General Manager,
Long Distance
Services
The Long Distance
System
• 15 routes, carrying more than 4.7M riders in FY
2013
• A vital public service:
– 15% of ridership
– 11% of frequencies, but 43% of passenger-miles
– 43% of identified passengers with disabilities who use Amtrak
– Only Amtrak trains in 23 of the 46 states we serve
• Two trains carry a fifth of all LD passengers:
– Empire Builder (11.3%)
– Coast Starlight (10.1%)
• 2008 DOT IG study estimated that an 85% average OTP would save $136M (in 2006 dollars)
– About $160M today
– In FY 2006, LD OTP was 30%
2
The LD Business Line
• Unified organization
– Terminal services
– Road operations
– On-board services
– Route directors
– Amtrak-operated commuter services (e.g., Metrolink)
• Three geographical regions
– Southwest (LA, Dallas, Albuquerque)
– Central (Chicago, Denver, St. Louis)
– Southeast (Richmond, Miami, New Orleans)
• Partnering with other business lines
– NEC ( Silver Service, Cardinal, Lake Shore, Capitol Limited )
– State-supported ( California Zephyr, Empire Builder, Coast Starlight ,
Midwestern State-supported services)
3
P&L responsibility for all Amtrak Long Distance services
The LD strategic concept
Deliver value by planning and implementing an optimal mix of short and long-term initiatives to increase the effectiveness and efficiency of service delivery while improving the bottom line.
Improvement Opportunities Challenges / Risks
Understand areas of opportunity and develop plans to drive improvement:
Understand areas of challenge and develop plans to mitigate risk:
• Increase Coach Capacity
• Employee Growth
• Equipment/Facility Utilization
• Reduce Financial Footprint
• Route Directors
• Safety
• Optimize Process
Standardization
• Improve Host Railroad
Relationships
We’re not trying to chop our way to success
4
Some specific challenges
Sean Lamb photo
• The Southwest Chief
• On-time performance (OTP)
5
Amtrak’ s Southwest Chief
Colorado
Kansas
La Junta
New Mexico
Route Miles Under Review (632.4)
Remainder of SW Chief Route
At stake: service in 9 communities across three states with over 66,000 passengers in FY12
This route connects Albuquerque and Kansas City with Los Angeles and Chicago
6
LD train performance is bad and getting worse
Long Distance Endpoint On-Time Performance by month, FY12-14
40,0%
30,0%
20,0%
10,0%
0,0%
90,0%
80,0%
70,0%
60,0%
50,0%
FY 2012
FY 2013
FY 2014
Month
7
Not just more delay – longer delay
1500
1400
1300
1200
1100
1000
900
800
700
600
BNSF CN CP
Carrier
CSX NS UP
FY 2013 YTD
FY 2014 YTD
“YTD” is year to date
8
The Amtrak System, 2014
Trouble Areas
Legend
At or above average OTP
0-10% below average OTP
10-20% below average OTP
Over 20% below average OTP
9
The bottom line
• Amtrak is strongly committed to the long distance services
• Our goal is to make the existing services better financial performers:
– More riders
– More revenue
– Better cost recovery
•
The decline in OTP over the past year is serious enough that it threatens every one of these goals
• Fixing it is Job One
• We are currently pursuing matters through the STB
– CN preference case
– Request to monitor train handling on freight railroads
10
