ABB Q1 2014 financial statements.pdf
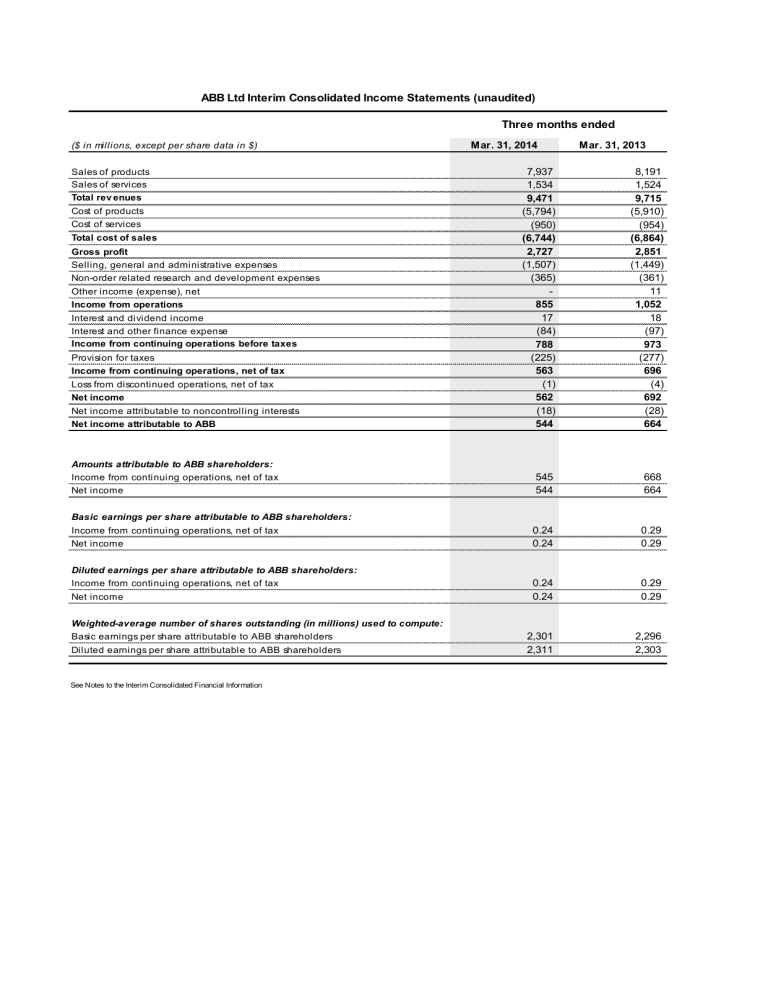
ABB Ltd Interim Consolidated Income Statements (unaudited)
($ in millions, except per share data in $)
Three months ended
Mar. 31, 2014 Mar. 31, 2013
Sales of products
Sales of services
Total rev enues
Cost of products
Cost of services
Total cost of sales
Gross profit
Selling, general and administrative expenses
Non-order related research and development expenses
Other income (expense), net
Income from operations
Interest and dividend income
Interest and other finance expense
Income from continuing operations before taxes
Provision for taxes
Income from continuing operations, net of tax
Loss from discontinued operations, net of tax
Net income
Net income attributable to noncontrolling interests
Net income attributable to ABB
7,937
1,534
9,471
(5,794)
(950)
(6,744)
2,727
(1,507)
(365)
-
855
17
(84)
788
(225)
563
(1)
562
(18)
544
8,191
1,524
9,715
(5,910)
(954)
(6,864)
2,851
(1,449)
(361)
11
1,052
18
(97)
973
(277)
696
(4)
692
(28)
664
Amounts attributable to ABB shareholders:
Income from continuing operations, net of tax
Net income
Basic earnings per share attributable to ABB shareholders:
Income from continuing operations, net of tax
Net income
Diluted earnings per share attributable to ABB shareholders:
Income from continuing operations, net of tax
Net income
Weighted-average number of shares outstanding (in millions) used to compute:
Basic earnings per share attributable to ABB shareholders
Diluted earnings per share attributable to ABB shareholders
See Notes to the Interim Consolidated Financial Information
0.24
0.24
2,301
2,311
545
544
0.24
0.24
0.29
0.29
2,296
2,303
668
664
0.29
0.29
ABB Ltd Interim Condensed Consolidated Statements of Comprehensive Income (unaudited)
($ in millions)
Three months ended
Mar. 31, 2014 Mar. 31, 2013
Total comprehensiv e income, net of tax
Total comprehensive income attributable to noncontrolling interests, net of tax
Total comprehensiv e income attributable to ABB shareholders, net of tax
489
(15)
474
309
(26)
283
See Notes to the Interim Consolidated Financial Information
ABB Ltd Interim Consolidated Balance Sheets (unaudited)
($ in millions, except share data)
Cash and equivalents
Marketable securities and short-term investments
Receivables, net
Inventories, net
Prepaid expenses
Deferred taxes
Other current assets
Total current assets
Property, plant and equipment, net
Goodwill
Other intangible assets, net
Prepaid pension and other employee benefits
Investments in equity-accounted companies
Deferred taxes
Other non-current assets
Total assets
Accounts payable, trade
Billings in excess of sales
Short-term debt and current maturities of long-term debt
Advances from customers
Deferred taxes
Provisions for warranties
Other provisions
Other current liabilities
Total current liabilities
Long-term debt
Pension and other employee benefits
Deferred taxes
Other non-current liabilities
Total liabilities
Commitments and contingencies
Stockholders' equity:
Capital stock and additional paid-in capital (2,314,743,264 issued shares at
March 31, 2014, and December 31, 2013)
Retained earnings
Accumulated other comprehensive loss
Treasury stock, at cost (13,531,610 and 14,093,960 shares at March 31, 2014, and December 31, 2013, respectively)
Total ABB stockholders' equity
Noncontrolling interests
Total stockholders' equity
Total liabilities and stockholders' equity
See Notes to the Interim Consolidated Financial Information
Mar. 31, 2014
6,402
865
12,215
6,201
305
807
715
27,510
4,872
1,539
1,435
1,780
259
1,307
1,759
4,042
16,993
7,612
1,561
1,254
1,667
29,087
6,171
10,600
3,120
96
192
398
706
48,793
Dec. 31, 2013
6,021
464
12,146
6,004
252
832
706
26,425
5,112
1,714
453
1,726
259
1,362
1,807
4,242
16,675
7,570
1,639
1,265
1,707
28,856
6,254
10,670
3,297
93
197
370
758
48,064
1,761
19,730
(2,082)
(236)
19,173
533
19,706
48,793
1,750
19,186
(2,012)
(246)
18,678
530
19,208
48,064
ABB Ltd Interim Consolidated Statements of Cash Flows (unaudited)
Three months ended
Mar. 31, 2014 Mar. 31, 2013 ($ in millions)
Operating activ ities:
Net income
Adjustments to reconcile net income to net cash used in operating activities:
Depreciation and amortization
Pension and other employee benefits
Deferred taxes
Net gain from sale of property, plant and equipment
Other
Changes in operating assets and liabilities:
Trade receivables, net
Inventories, net
Trade payables
Accrued liabilities
Billings in excess of sales
Provisions, net
Advances from customers
Income taxes payable and receivable
Other assets and liabilities, net
Net cash used in operating activ ities
562
333
(28)
(13)
(8)
15
(106)
(223)
(201)
(217)
(158)
(99)
59
48
(9)
(45)
692
321
(11)
4
(9)
14
(504)
(248)
(197)
(192)
(71)
(28)
75
(67)
(2)
(223)
Inv esting activ ities:
Purchases of marketable securities (available-for-sale)
Purchases of short-term investments
Purchases of property, plant and equipment and intangible assets
Acquisition of businesses (net of cash acquired) and increases in cost and equity investments
Proceeds from sales of marketable securities (available-for-sale)
Proceeds from maturity of marketable securities (available-for-sale)
Proceeds from short-term investments
Other investing activities
Net cash used in inv esting activ ities
Financing activ ities:
Net changes in debt with original maturities of 90 days or less
Increase in debt
Repayment of debt
Delivery of shares
Acquisition of noncontrolling interests
Dividends paid to noncontrolling shareholders
Other financing activities
Net cash prov ided by (used in) financing activ ities
Effects of exchange rate changes on cash and equivalents
Net change in cash and equiv alents - continuing operations
Cash and equivalents, beginning of period
Cash and equiv alents, end of period
988
3
(13)
1
-
(7)
9
981
(6)
381
6,021
6,402
(84)
(438)
(203)
(3)
14
68
23
74
(549)
(173)
(5)
(216)
(26)
116
-
32
46
(226)
(507)
215
(523)
1
(1)
(15)
(3)
(833)
(138)
(1,420)
6,875
5,455
Supplementary disclosure of cash flow information:
Interest paid
Taxes paid
67
198
28
331
See Notes to the Interim Consolidated Financial Information
($ in millions)
Balance at January 1, 2013
Comprehensive income:
Net income
Foreign currency translation adjustments (net of tax of $8)
Effect of change in fair value of available-for-sale securities
(net of tax of $(1))
Unrecognized income related to pensions and other postretirement plans (net of tax of $26)
Change in derivatives qualifying as cash flow hedges (net of tax of $2)
Total comprehensiv e income
Changes in noncontrolling interests
Dividends paid to noncontrolling shareholders
Share-based payment arrangements
Delivery of shares
Other
Balance at March 31, 2013
ABB Ltd Interim Consolidated Statements of Changes in Stockholders' Equity (unaudited)
C a p it a l st o c k a n d a d d it io n a l p a id
p ita l in c a
1,691
R e ta in e d e a rn in g s
18,066
664
(11)
14
(7)
1
1,688 18,730 u rr e n cy
F o re ig n c a d ju s tm e n ts tr a n s la ti o n
(580)
Accumulated other comprehensiv e loss
U n re a liz e d a o ss e s
) o
(l g a in s v a ila b le
-f o rs a le n s e c u ri ti e s
24
P e n s io n a n p d o th e r o s tr e ti re m e n t p la n a d ju s tm e n ts
U n re a liz e c d g a in s a s h fl o
(l o ss e s
) o f e d e ri v w h e d g a ti v e s
(2,004) 37
T o ta l a c c u m c o m p u la te d re h e n o th e r s iv e lo s s
(2,523)
T re a s u ry s to ck
(328)
T o ta l
A
B
B e q u it y s to c k h o ld e rs
'
16,906
N o n c o n tr o ll in g in te re s ts
540
T o ta l s to c k h o ld e rs
' e q u it y
17,446
(475)
(1,055)
(6)
18
90
(1,914)
10
47
(475)
(6)
90
10
(2,904)
8
(320)
664
(475)
(6)
90
10
283
(11)
-
14
1
1
17,194
28
(3)
1
26
7
(26)
547
692
(478)
(6)
91
10
309
(4)
(26)
14
1
1
17,741
($ in millions)
Balance at January 1, 2014
Comprehensive income:
Net income
Foreign currency translation adjustments (net of tax of $(3))
Effect of change in fair value of available-for-sale securities
(net of tax of $0)
Unrecognized income related to pensions and other postretirement plans (net of tax of $6)
Change in derivatives qualifying as cash flow hedges (net of tax of $(4))
Total comprehensiv e income
Dividends paid to noncontrolling shareholders
Share-based payment arrangements
Delivery of shares
Balance at March 31, 2014
See Notes to the Interim Consolidated Financial Information
C a p it a l st o c k a n d a d d it io n a l p a id
p ita l in c a
1,750
R e ta in e d e a rn in g s
19,186
544
20
(9)
1,761 19,730
F o re ig n c e n cy u rr a d ju s tm e n ts tr a n s la ti o n
(431)
Accumulated other comprehensiv e loss
U n re a liz e d a o ss e s
) o g a in s
(l v a ila b le
-f o rs a le n s e c u ri ti e s
7
P e n s io n a n p d o th e r o s tr e ti re m e n t p la n a d ju s tm e n ts
U n re a liz e c d g a in s a s h fl o
(l o ss e s
) o f e d e ri v w h e d g a ti v e s
(1,610) 22
T o ta l a c c u m c o m p u la te d re h e n o th e r s iv e lo s s
(2,012)
T re a s u ry s to ck
(246)
T o ta l
A
B
B e q u it y s to c k h o ld e rs
'
18,678
N o n c o n tr o ll in g in te re s ts
530
T o ta l s to c k h o ld e rs
' e q u it y
19,208
(73)
(504)
2
9
13
(1,597)
(12)
10
(73)
2
13
(12)
(2,082)
10
(236)
544
(73)
2
13
(12)
474
-
20
1
19,173
18
(3)
15
(12)
533
562
(76)
2
13
(12)
489
(12)
20
1
19,706
