Chapter Seven
advertisement
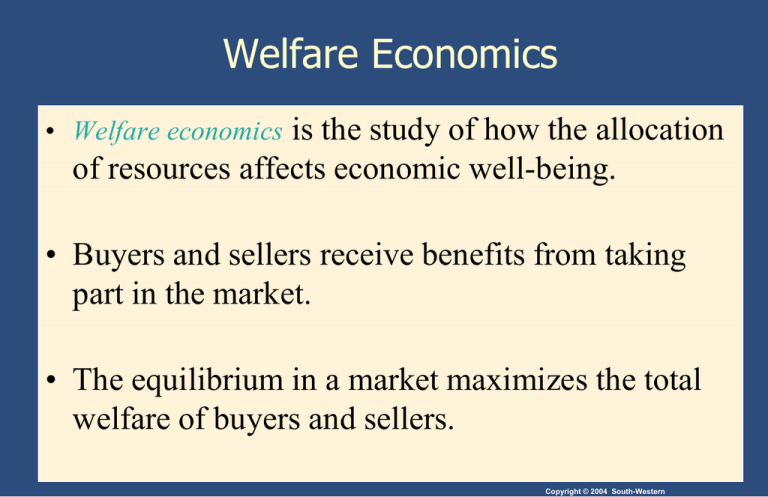
Welfare Economics • Welfare economics is the study of how the allocation of resources affects economic well-being. • Buyers and sellers receive benefits from taking part in the market. • The equilibrium in a market maximizes the total welfare of buyers and sellers. Copyright © 2004 South-Western What Does Consumer Surplus Measure? • Consumer surplus, the amount that buyers are willing to pay for a good minus the amount they actually pay for it, measures the benefit that buyers receive from participating in the market. Copyright © 2004 South-Western CONSUMER SURPLUS • Willingness to pay is the maximum amount that a buyer will pay for a good. • It measures how much the buyer values the good or service. • Consumer surplus is the buyer’s willingness to pay for a good minus the amount the buyer actually pays for it. Copyright © 2004 South-Western Using the Demand Curve to Measure Consumer Surplus • The market demand curve depicts the various quantities that buyers would be willing and able to purchase at different prices. • The area below the demand curve and above the price measures the consumer surplus in the market. Copyright © 2004 South-Western Figure 3 How the Price Affects Consumer Surplus (a) Consumer Surplus at Price P Price A Consumer surplus P1 B C Demand 0 Q1 Quantity Copyright©2003 Southwestern/Thomson Learning Figure 3 How the Price Affects Consumer Surplus (b) Consumer Surplus at Price P Price A Initial consumer surplus P1 P2 0 C B Consumer surplus to new consumers F D Additional consumer surplus to initial consumers E Demand Q1 Q2 Quantity Copyright©2003 Southwestern/Thomson Learning What Does Consumer Surplus Measure? • Producer surplus, the amount that sellers receive from selling a good minus the amount that it cost to produce it, measures the benefit that sellers receive from participating in the market. Copyright © 2004 South-Western PRODUCER SURPLUS • Willingness to sell is the minimum amount that a seller will sell a good for. • It measures the cost to the seller of producing the good or service. • Producer surplus is the price the seller receives seller’s for a good minus the amount it cost to produce it. Copyright © 2004 South-Western Using the Supply Curve to Measure Producer Surplus • The market supply curve depicts the various quantities that sellers would be willing and able to sell at different prices. • The area below the price and above the supply curve measures the producer surplus in a market. Copyright © 2004 South-Western Figure 6 How the Price Affects Producer Surplus (a) Producer Surplus at Price P Price Supply P1 B Producer surplus C A 0 Q1 Quantity Copyright©2003 Southwestern/Thomson Learning Figure 6 How the Price Affects Producer Surplus (b) Producer Surplus at Price P Price Supply Additional producer surplus to initial producers P2 P1 D B Initial producer surplus E F C Producer surplus to new producers A 0 Q1 Q2 Quantity Copyright©2003 Southwestern/Thomson Learning MARKET EFFICIENCY • Three Insights Concerning The Competitive Market Equilibrium Outcome • Goods consumed by buyers who value them most highly measured by WTP (D). • Goods produced by sellers with lowest opportunity cost of production measured by WTS (S). • Sum of CS & PS, total well-being is maximized. Copyright © 2004 South-Western The Efficiency of the Equilibrium Quantity Price Supply • Buyers Value to buyers Cost to sellers • Sellers Cost to sellers Value to buyers Equilibrium quantity 0 Value to buyers is greater than cost to sellers. Demand Quantity Value to buyers is less than cost to sellers. Copyright © 2004 South-Western Copyright©2003 Southwestern/Thomson Learning • Buyers • Sellers In the Chips P Qd Qs 3.50 3.70 3.90 4.10 4.30 4.50 4.70 4.90 5.10 35 33 31 29 27 23 18 11 4 4 11 18 23 27 29 31 33 35 • Buyers • Sellers Market Forces & Equilibrium • Price squeezes to where Qs = Qd and the market clears. • This price facilitates all transactions that can improve the well-being of market participants. • Goods purchased by those with highest value. • Goods produced by those with lowest opportunity cost. • The well-being of society is maximized. Copyright © 2004 South-Western Figure 7 Consumer and Producer Surplus in the Market Equilibrium Price A D Supply Consumer surplus Equilibrium price E Producer surplus B Demand C 0 Equilibrium quantity Quantity Copyright © 2004 South-Western Copyright©2003 Southwestern/Thomson Learning Summary • Consumer surplus is the buyers’ willingness to pay for a good minus the amount they actually pay for it. • Consumer surplus measures the benefit buyers get from participating in a market (in $). • Consumer surplus can be computed by finding the area below the demand curve and above the price. Copyright © 2004 South-Western Summary • Producer surplus is the amount sellers receive from selling a good minus their opportunity cost of production. • Producer surplus measures the benefit sellers get from participating in a market (in $). • Producer surplus can be computed by finding the area below the price and above the supply curve. Copyright © 2004 South-Western Summary • An allocation of resources that maximizes the sum of consumer surplus and producer surplus is efficient. • The competitive market equilibrium outcome maximizes the sum of consumer surplus and producer surplus and thus maximizes the well-being of market participants. • All transactions that could possibly improve the wellbeing of market participants have taken place. Copyright © 2004 South-Western

