AP Environmental Science Stream Study
1. Question
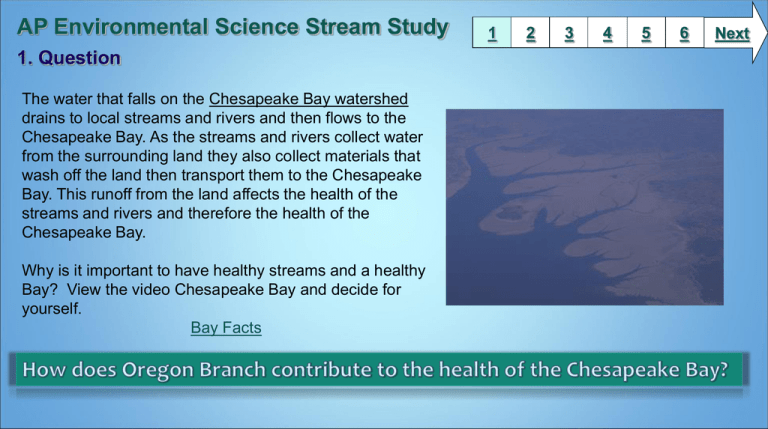
The water that falls on the Chesapeake Bay watershed
drains to local streams and rivers and then flows to the
Chesapeake Bay. As the streams and rivers collect water
from the surrounding land they also collect materials that
wash off the land then transport them to the Chesapeake
Bay. This runoff from the land affects the health of the
streams and rivers and therefore the health of the
Chesapeake Bay.
Why is it important to have healthy streams and a healthy
Bay? View the video Chesapeake Bay and decide for
yourself.
Bay Facts
1
2
3
4
5
6
Next
2. Information Sources
1
2
3
4
5
6
The following web resources will provide background information and will be useful in answering the previous
question. Feel free to find additional web resources.
Watershed Definition
Chemical Testing of Water
CBP Chesapeake Bay Watershed
Water Quality Factors
What is a watershed?
Chemical Testing of Water
Land Use
Macroinvertebrates
Water Quality and Land Use
Stream Health and Macroinvertebrates
Invertebrates as Indicators
Riparian Buffers
Riparian Forest Buffer - Fact Sheet
Riparian Buffers and Stream Health
Streamside Tree Buffers
Impervious Surface
Stream Health and Impervious Surfaces
Next
3. Student Activity
Create a Stream Health Report for Oregon Branch
During your field experience at Oregon Ridge Nature Center you will
collect physical, chemical, and biological data from Oregon Branch.
In order to determine the health of this stream and how it
contributes to the health of the Chesapeake Bay, you must first
analyze the data you collected.
1. Analysis of Data
Analyze the data you collected from Oregon Branch stream by
completing the following:
Physical - Describe the riparian buffer and the stream
channel - Physical Survey
Chemical - Water Quality Index (WQI)
Biological - SOS Stream Quality Survey
Simpson Index of Diversity
Click HERE for the necessary documents and resources
2. Summary
Summarize the results of your data analysis and state how it relates
to stream health.
1
2
3
4
5
6
Next
4. Assessment Activity
1
2
3
4
You are now ready to complete a Stream Health Report where you will present your
data, analysis, and conclusion.
The report must have the following parts:
1. A general description of the stream’s watershed
(land use , quality of riparian buffer, headwaters etc.)
3. A section showing the physical, chemical, and biological data you collected and and
the results of your analysis.
4.A summary of the health of Oregon Branch supported by your data.
5. A conclusion in which you address the original question:
How does the Oregon Branch contribute to the health of the Chesapeake Bay?
5
6
Next
5. Extension Activity
1
2
3
4
5
6
What might macroinvertebrates tell you about land use?
1. Look at the 2005 Benthic Macroinvertebrate Index (BIBI_Map) located HERE.
2. Examine the legend in the right corner. What color indicates a poor BIBI score for
macroinvertebrates? Which color indicates a high macroinvertebrate score?
3. Locate the Baltimore Beltway (695) that circles Baltimore City and part of Baltimore County.
4. Describe the BIBI scores for the area inside the beltway.
5. Explain the possible reasons for these scores.
6. What might macroinvertebrates tell you about land use?
Next
6. Teacher Support Materials
1
2
3
Advanced Placement Environmental Science
Aquatics Stream Study
Objective: Analyze the role of a Maryland stream, Oregon Branch, and how it contributes to the health of the Chesapeake bay.
Differentiation: All students complete the same activity and assessment. Students may select from the list of resources provided to gather
information. Students may choose any Web 2.0 tool to complete the activities and assessment.
Time Management Strategies: It is suggested that this activity be completed over the course of three class periods. This activity could also
be conducted in teams of two or more students.
Technology Infusion: Students should also be familiar with opening hyperlinks in both the documents and in the Power point presentation.
The students should also be familiar with Web 2.0 tools listed on the BCPS Library and Information Services page.
AVID Strategy: The following AVID strategy is supported in this lesson: inquiry based learning and writing in Science
Learning Styles: Field Dependent, Field independent, Visual and Reflective Learners, Global Understanding
Common Core
Integration of Knowledge and Ideas
RST.6-8.7. Integrate quantitative or technical information expressed in words in a text with a version of that information expressed visually (e.g., in a flowchart,
diagram, model, graph, or table).
RST.9-10.7. Translate quantitative or technical information expressed in words in a text into visual form (e.g., a table or chart) and translate information expressed
visually or mathematically (e.g., in an equation) into words.
RST.11-12.7. Integrate and evaluate multiple sources of information presented in diverse formats and media (e.g., quantitative data, video, multimedia) in order to
address a question or solve a problem.
Created by P Ghingher linked to email address
BCPS Research Module or Slam Dunk Model, Copyright 2012, Baltimore County Public Schools, MD, all rights reserved. The models may be used for educational,
non-profit school use only. All other uses, transmissions, and duplications are prohibited unless permission is granted expressly.
4
5
6

