Presentation
advertisement
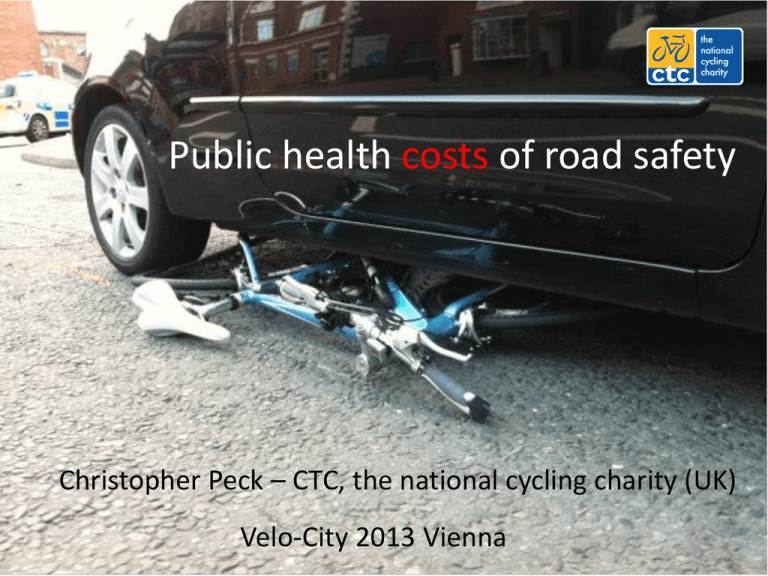
Public health costs of road safety Christopher Peck – CTC, the national cycling charity (UK) Velo-City 2013 Vienna What is road safety? “By 2020 there will be 1.9m killed each year on the roads, 50m injured.” – UN Decade of Road Safety Road deaths in GB 1930-2010 Cycle fatalities have fallen by 92% since the 1940s 2010 2008 2006 2004 2002 2000 1998 1996 1994 1992 1990 1988 1986 1984 1982 1980 1978 1976 1974 1972 1970 1968 1966 1964 1962 1960 1958 1956 1954 1952 1950 Fatalities per 100,000 Rate per 100,000 people 70 60 50 40 30 20 10 0 Per billion kms 120 Fatalities per billion kms 100 80 60 40 20 0 How to get it wrong, spectacularly “As you massively increase the amount of people who cycle, your figures for deaths go up. On the European table I have here, the Netherlands is fourth from the bottom, with 0.84 per 100,000 of population, whereas we [UK] are seventh with 0.17. … I think the Netherlands might want to come and see us to find out how we are making sure that so few people are killed in cycling terms as we increase the numbers of people cycling, because the figures would indicate that we can perhaps do a bit better than them.” - Road Safety Minister Mike Penning, speaking in the UK Parliament in 2012 Measuring risk of cycling, wrong and right Which road user is involved in the most road deaths? 1,800 1,600 Cars, buses, van and lorries present far more risk to other road users, whereas pedestrians, cyclists and motorcyclists are more often victims. Road deaths 1,400 1,200 1,000 883 Others killed in collision with road user 800 600 Road user killed 453 362 400 200 107 7 0 34 27 28 Which road user represents the most danger per mile travelled? 20 Road deaths of thrid parties per billion miles 18 16 14 12 10 8 6 4 2 0 Per billion miles travelled cycles are involved in fewer deaths of other road users than any other mode of transport. Overweight and obese, 1980-2011 70 65 In the USA, obesity increased from 2010 1978 60 % obese or overweight 55 50 45 Obese 15% Obese 36% Overweight Over33% weight 32% Normal or under 53% Normal or under 31% 40 35 30 25 20 UK USA Netherlands Italy Germany Sweden Public health consequences of… 600,000 2011 England and Wales deaths 500,000 Other cancers Breast, prostate, colorectal 59,568 83,613 484,367 Physical inactivity reduces mortality risks of these cancers by 30-50% Around 35% of cardiovascular diseases attributable to physical inactivity + another ~25% partly attributable to air pollution 400,000 300,000 200,000 143,181 139,706 100,000 1,815 98 Transport accidents Cycles All deaths Cancer Diseases of the circulatory system Where ‘road safety’ goes wrong • Any intervention or law that reduces physical activity will almost inevitably do more harm than good. • de Jong (2012) – helmet legislation or promotion only has a net health benefit if injuries prevented exceed health costs lost to reduced cycling. • This is: “very difficult to achieve except in extreme circumstances” Conclusions • Set targets and measure the right things… Numbers of people killed or seriously injured Very bad Rate of death or injury to users per 100,000 population (current) Poor Rate of death or injury per mile, trip or hour (measured by some) Better Rate of death or injury to third parties (danger posed) Good Overall public health impact of different transport modes (road death or injury caused AND air quality, cardiovascular disease etc) Best • Get the balance right between promoting cycling for public health and road safety campaigns or laws which deter people from cycling Questions? • How is safety and risk measured where you live? • How do we change institutional and organisational approaches to risk and safety? Thanks! Christopher Peck CTC – the national cycling charity chris.peck@ctc.org.uk

