Week 6 - Truth Recordings
advertisement
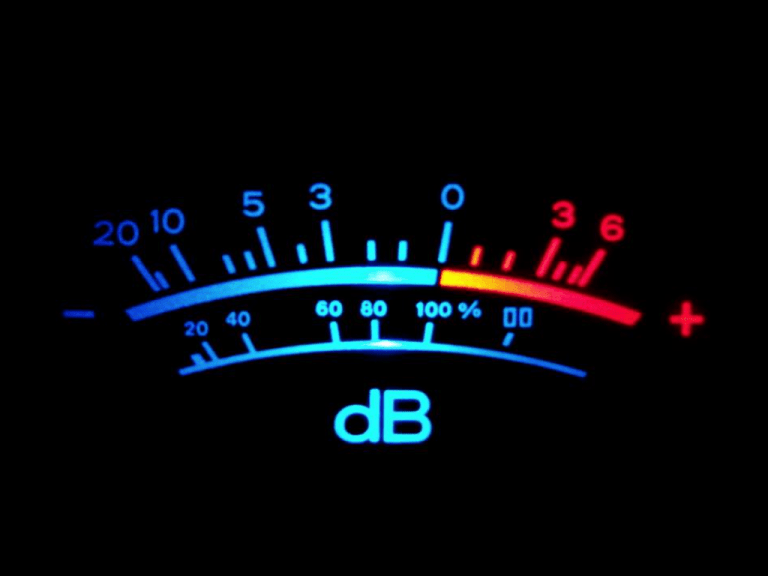
AUD202 Audio and Acoustics Theory The Decibel Inverse Square Law / SPL Meters Last Week > The Human Ear and the Hearing Process Noise Induced Hearing Loss Hearing Protection OH&S Principles UPCOMING REPORT!!! Noise Induced Hearing Loss Report 1000 words Requires Reference and Bibliography Sections Lots of things to follow in the JMC Style Guide Upcoming Events 18 Days - NIHL Report 39 Days - Sound Observations Report 49 Days - Exam THE DECIBEL The Decibel is a logarithmic value that expresses the ratio between two quantities. Decibel White noise -3dB per step White noise -1dB per step http://www.phys.unsw.edu.au/jw/dBNoFlash.html Decibel White noise -0.3dB per step http://www.phys.unsw.edu.au/jw/dBNoFlash.html Logarithms Logarithms are useful because we can conveniently represent very large or small numbers, and carry out multiplication of ratios by simple addition and subtraction. Some examples: 1000 watts relative to 1 watt is 30dB 100,000 watts relative to 1 watt is 50dB 100,000,000 watts relative to 1 watt is 80dB Logarithms The logarithm of a number is the power which the base has to be raised to produce that number The logarithm of 1000 is 3, because 1000 is base 10 to the power 3 1000 = 10³ = 10 x 10 x 10 Calculating a Difference in dB The difference in dB between 100 and 1 100 / 1 = 100 Log100 = 2 Log100 = 2 Bells The decibel is 1 tenth of a Bell, so: 2 Bells x 10 = 20 Decibels 0dB Reference Values 0dBSPL = 0.00002 Pa 0dBV = 1 Volt 0dBu = 0.775 Volts 0dBm = 0.001 Watts The dB Formulas Sound Pressure Levels dBSPL = 20 x log (SPL / SPLref) Voltage dBV = 20 x log (V / Vref) dBu = 20 x log (V / Vref) Watts dBm = 10 x log (P / Pref) Sound Pressure Level (SPL) Sound Pressure Level is a logarithmic measure of the sound pressure relative to a reference level 0dBSPL = 0.00002 Pa (20 µPa) dBSPL = 20log (SPL / SPLref) SPL is the measured sound pressure (in cm²) SPLref is the reference sound pressure (0.00002 Pa) Voltage (V) Voltage is the potential difference between two points (e.g. the + and - sides of a battery) 0dBV = 1 volt dBV = 20log (V / Vref) V is the measured voltage Vref is the reference voltage (1 volts) Voltage (u) dBu is referenced to 0.775 volts RMS (Root Mean Square) 0dBu = 0.775 volts dBu = 20log (V / Vref) V is the measured voltage Vref is the reference voltage (0.775 volts) Power (P) Power is the rate at which energy is produced or used 0dBm = 0.001 watts dBm = 10log (P / Pref) dBm is the signal level P is the measured wattage Pref is the reference wattage (0.001 watt) Two Line Level Standards Pro equipment: +4dBu Consumer equipment: -10dBV +4dBu and -10dBV Pro equipment signal level is +4dBu Consumer equipment signal level is -10dBV 0dBu = 0.775 volts 0dBV = 1 volt SPL and SIL Sound Pressure Level (SPL) is measured in Pascals (Pa) and 0dBSPL is 0.00002Pa Sound Intensity Level (SIL) is measured in watts per square meter (W/m2). 0dBSIL is: 10-12W/m2 or 0.000000000001W/m2 SPL and SIL Sound Intensity (SIL) is difficult to measure which is why we typically use Sound Pressure (SPL). RMS vs Peak • The peak value is the highest voltage that the waveform reaches • The RMS (Root-Mean-Square) value is the effective value of the total waveform. In audio it is the continuous or music power that the amplifier can deliver. • The effective or rms value of a sine wave of current is 0.707 times the maximum value of current RMS vs Peak Voltage SPL METERS SPL Meters In order to measure sound levels we need a calibrated microphone, preamp and display. We have various settings to allow us to choose what we’re measuring (such as transient response & frequency response). Digitech SPL Meter Model: QM 1589 Bruel & Kjaer 2250 Sound Level Meter SPLnFFT Noise Meter By Fabien Lefebvre SPL Graph by Studio Six Digital. “SPL Graph is an audio level chart recorder for the iPhone… You can optionally record the audio for the graph, and even email graph results at the end of a test” (Studio Six Digital 2013). Weighted Frequency Responses Fig.1 A-Weighted frequency response (Au.noisemeters.com, 2014) Fig.2 A-Weighted frequency response (Au.noisemeters.com, 2014) SPL Meters The options to understand on an SPL meter are: • A-weighting versus C-weighting • Fast or slow response • High or low (volume range) Remember, the A-weighting is close to human perception of loudness THE INVERSE SQUARE LAW The Inverse Square Law In a free field, doubling the distance from the source results in a level drop of approximately 6 dB The Inverse Square Law Next Week > The Doppler Effect Delay Perception SPL Meters Links • Institute of Acoustics > ioa.org.uk References Au.noisemeters.com, (2014). Frequency Weightings - A-Weighted, Cweighted or Z-Weighted. [online] Available at: http://au.noisemeters.com/help/faq/frequency-weighting.asp [Accessed 10 May 2014]
