Analysis of USA Swimming`s All-Time Top 100 Times
advertisement
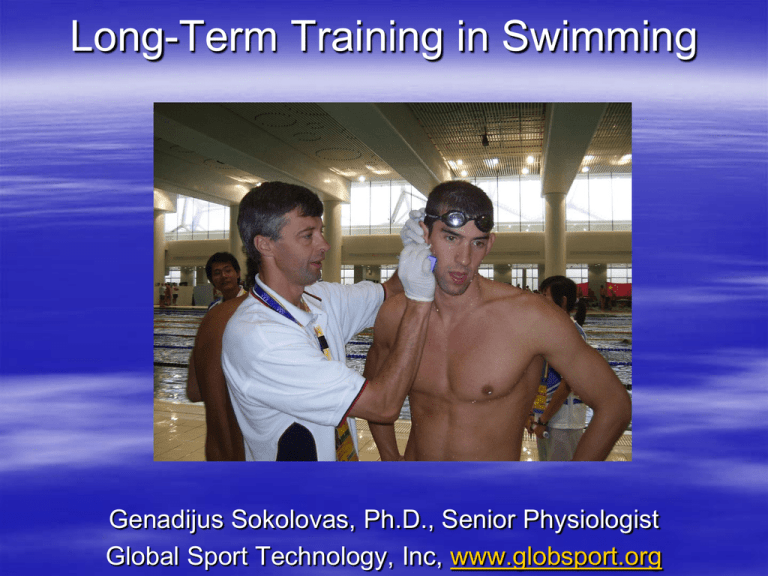
Long-Term Training in Swimming Genadijus Sokolovas, Ph.D., Senior Physiologist Global Sport Technology, Inc, www.globsport.org Top-100 Study The purpose of this study was to investigate the performances of elite level swimmers based on the USA Swimming’s All-Time Top 100 times. May early high-level performances limit a swimmer’s progression later in his/her career? Methods Analysis of USA Swimming’s All-Time Top 100 age group times by girls and boys. Five age groups: 10-under, 11-12, 13-14, 15-16, and 17-18. Swimming events: 100, 200, and 500 freestyle; 100 and 200 backstroke; 100 and 200 breaststroke; 100 and 200 butterfly; and the 200 individual medley. Calculating the percent of participation. Participation at USA All-Time Top 100 in All Events at Age 17-18 (Females) Top 100 10.3% Age 10 & under Top 100 20.3% Top 100 Age 11-12 Top 100 36.9% Age 13-14 49.7% Top 100 Age 15-16 Age 17-18 Participation for USA All-Time Top 100 in 100 Freestyle at Age 17-18 (Males) Top 100 13.2% Age 10 & under Top 100 12.6% Top 100 Age 11-12 Top 100 31.1% Age 13-14 53.5% Top 100 Age 15-16 Age 17-18 Freestyle Events for Girls Backstroke and Breaststroke Events for Girls Age 15-16 vs 17-18 There is still a low number of elite swimmers at age 15-16 for girls and boys. About half of the elite swimmers in the Top 100 at age 17-18 were new swimmers who were never ranked in the Top 100 at any age. This statistics shows that most of the future elite swimmers swim under Top 100 times until age 15-16. Females vs Males There is a small difference between elite female and male freestyle swimmers at age 11-12 and 13-14, where it appears that higher numbers of female freestylers were ranked in the Top 100. Higher numbers for females may be related to earlier biological maturation in girls. Selection of Main Event by Females 51.6% of elite female swimmers are listed in other events at age 10 and under. This number decreases with age and reaches 37.9%, 26.6% and 24.9% at age 11-12, 13-14 and 15-16, respectively. Most of elite female swimmers select their event at age 13-14. Selection of Main Event by Males 69.6% of elite male swimmers are listed in other events at age 10 and under. This number decreases with age and reaches 55.6%, 40.8% and 26.7% at age 11-12, 13-14 and 15-16, respectively. The elite male swimmers select their events at age 15-16 or about 2 years later than elite female swimmers. Conclusion 1 A small number of elite swimmers from the Top 100 at age 17-18 were ranked in the Top 100 at a younger age. Typically, a little over 10 % were ranked as a 10-under, less than 20% as a 11-12 year old, a little over 30% as a 13-14 year old, and about 50% as a 15-16 year old. Conclusion 2 The analysis shows that most of elite level swimmers were unknown at young ages. About a half of elite swimmers at Top 100 at age 17-18 are new swimmers, which never were listed at Top 100 at any age. Most of future elite swimmers swim slower than age group champions, especially at ages until 15-16 years. Conclusion 3 Many participants ranked in the Top 100 as age groupers are not present in the Top 100 as they become an elite swimmer in the 1718 age group. It may be related to their early biological maturation and/or a high training volume and intensities at a young age. Conclusion 4 Elite level swimmers change their events during long-term training. Elite female swimmers tend to change their events until the age of 13-14. Elite male swimmers tend to change their events until the age of 1516. What is the Goal in Career Training? Best performance: - 10 & under? - 11-12? - 13-14? - 15-16? - 17-18? - at the age of peak performance potential! 16 Average Age of Ten Best Swimmers in History (Freestyle) Event Men (years) Women (years) 50 FR 24.8 ± 2.7 25.3 ± 7.0 100 FR 25.3 ± 3.7 24.6 ± 6.7 200 FR 22.6 ± 2.1 20.8 ± 2.4 400 FR 22.1 ± 2.4 20.0 ± 2.1 1500/800 FR 21.3 ± 2.0 20.1 ± 2.6 17 Average Age of Ten Best Swimmers in History (Backstroke & Breaststroke) Event Men (years) Women (years) 100 BK 23.9 ± 1.7 21.9 ± 3.6 200 BK 23.1 ± 2.2 20.8 ± 3.7 100 BR 25.4 ± 2.5 21.3 ± 3.9 200 BR 23.6 ± 2.6 21.5 ± 3.3 BACKSTROKE BREASTSTROKE 18 Average Age of Ten Best Swimmers in History (Butterfly & IM) Event Men (years) Women (years) 100 FL 24.8 ± 3.0 25.1 ± 4.4 200 FL 23.5 ± 1.6 22.4 ± 4.6 200 IM 23.2 ± 1.1 20.5 ± 2.9 400 IM 22.9 ± 2.3 19.6 ± 2.7 FLY IM 19 Average Age of Ten Best Swimmers in History (Male, Free) 26.0 25.0 50 FR 100 FR 24.0 200 FR 23.0 400 FR 1500 FR 22.0 21.0 20.0 2000 2005 2008 Average Age of Ten Best Swimmers in History (Female, Free) 27.0 25.0 50 FR 100 FR 23.0 200 FR 21.0 400 FR 800 FR 19.0 17.0 15.0 2000 2005 2008 Swimming Performance Progression 2 V (m /s) 1.8 1.6 10 best swimmers 1.4 Elite level swimmer 1 1.2 Elite level swimmer 2 1 9 11 13 15 17 19 21 23 Age (years) 22 Swimming Performance Progression in Career Training PERFORMANCE PROGRESSION FOR 100 FREE MEN (LC) 1:11.20 01:12 Elite level swimmer A Elite level swimmer B Elite level swimmer C 01:07 1:00.13 TIME 01:03 0:57.30 0:55.55 0:54.63 0:53.40 0:52.15 0:49.73 00:59 00:54 00:50 0:48.93 0:49.18 0:49.02 00:46 11 12 13 14 15 16 17 18 19 20 21 22 YEARS 23 Swimming Performance Progression in Career Training Peak Performance / Performance at age 11 For Females – 0.71-0.89 (71-89%) For Males – 0.61-0.79 (61-79%) 24 Swimming Performance Progression in Career Training WINDOWS FOR PERFORMANCE PROGRESSION Lower level Time at age 11 Upper level TIME Ratios: Male - 0.61-0.79 (61-79%) Female - 0.71-0.89 (71-89%) 11 12 13 14 15 16 17 YEARS 18 19 20 21 22 23 Peak performance time 25 Optimal Swimming Performance Progression WINDOWS FOR 100 FREE MEN (LC) 01:19 1:19.90 01:15 1:10.65 01:11 Lower level 1:04.67 TIME 01:07 1:00.41 01:02 1:01.70 00:58 0:57.31 0:54.99 0:58.99 0:53.23 0:56.85 00:54 0:51.87 0:55.13 0:53.72 00:49 0:52.57 0:51.62 Upper level 0:50.80 0:50.83 0:50.16 0:49.95 0:49.28 0:48.74 0:49.61 0:49.14 0:48.74 00:45 11 12 13 14 15 16 17 YEARS 18 19 20 21 22 26 Optimal Swimming Performance Progression WINDOWS FOR 100 FREE MEN (LC) 1:19.90 01:19 01:15 Lower level 1:10.65 01:11 Upper level 1:04.67 TIME 01:07 1:00.41 Sub-elite level swimmer 01:02 1:01.70 00:58 0:57.31 0:58.99 0:54.99 0:53.23 0:56.85 00:54 0:51.87 0:55.13 0:53.72 0:52.57 00:49 0:51.62 0:50.80 0:50.83 0:50.16 0:49.95 0:49.28 0:48.74 0:49.61 0:49.14 0:48.74 00:45 11 12 13 14 15 16 17 YEARS 18 19 20 21 22 27 Optimal Swimming Performance Progression 01:20 WINDOWS FOR 100 FREE MEN (LC) 1:19.90 01:16 TIME 01:07 Upper level 1:04.67 Elite level swimmer 1:00.41 01:03 00:59 Lower level 1:10.65 01:12 1:01.70 0:57.31 0:54.99 0:58.99 0:53.23 0:56.85 00:54 0:51.87 0:55.13 0:53.72 00:50 0:52.57 0:51.62 00:46 11 12 13 14 15 16 17 0:50.80 0:49.95 0:49.28 0:48.74 0:50.83 0:50.16 0:49.61 0:49.14 0:48.74 18 19 20 21 22 YEARS 28 Performance Progression Model DATE CURRENT PERFORMANCE NAME LAST NAME AGE GENDER M STROKE Free DISTANCE TIME, Sec. 11 100 79 GOAL AGE TIME Age 11 Optimal Progression, Sec. 79.00 Time, Min., Sec. 1:19 12 13 14 15 16 17 18 19 20 70.16 64.34 60.29 57.37 55.21 53.58 52.33 51.36 50.60 1:10.16 1:4.34 1:0.29 0:57.37 0:55.21 0:53.58 0:52.33 0:51.36 0:50.6 65.91 61.70 58.62 56.30 54.53 53.16 52.08 51.23 50.55 74.09 66.66 61.71 58.25 55.75 53.91 52.51 51.45 50.64 21 50.00 0:50 50.00 50.00 Upper Level Lower Level 71.89 86.11 21 50 29 Performance Progression Model Forecast of performances progression in career training Optimal Progression, Sec. Upper Level 85.00 79.00 80.00 Lower Level Time 75.00 70.16 70.00 64.34 60.29 65.00 57.37 60.00 55.21 55.00 53.58 52.33 51.36 50.6050.00 50.00 10 12 14 16 18 20 Years 30 Duration of Career Training Age at Peak Performances Age at the Beginning of Career Training Maintenance of High Performances “Time Reserve” to prepare each swimmer to achieve their individual maximum potential 31 Duration of Career Training Age at the Beginning of Career Training Age at Peak Performance 6-8 years 18-25 years depending on gender, distance orientation and rate of individual maturation “Time Reserve” - 10-19 years!!! “Time Reserve” for Men (Freestyle) Years 1 3 5 7 9 11 13 15 16.8 50 m Free 17.3 100 m Free 14.6 200 m Free 400 m Free 1500 m Free 17 14.1 13.3 33 “Time Reserve” for Women (Freestyle) Years 1 3 5 7 9 11 13 50 m Free 15 17 17.3 100 m Free 16.6 200 m Free 12.8 400 m Free 12 800 m Free 12.1 34 Stages of Biological Maturation Early Childhood and Prepuberty – Girls - until 11 years, Boys - until 12 years Puberty – Girls - 11-14 years, Boys - 12-15 years Postpuberty – Girls - after 15 years, Boys - after 16 years 35 EARLY CHILDHOOD Age 4-6: – Kids don’t have good postural and balance skills – Very short attention spans – Imprecise eye movement – There is no advantage to begin swimming at this age CHILDHOOD Age 6-9: – Improved postural and balance skills – Good age to begin organized swimming practices – Longer attention spans, but still isn’t long enough to focus on long explanation – More precise eye movement – Simple swimming drills – Difficulty to accomplish complex skills PREPUBERTY Age 10-12: Good postural and balance skills Growth in extremities and long bones Maturational differences between genders and early/late maturers Easy to learn advanced swimming technique Complex swimming and synchro drills PUBERTY Age 12-17: – Improved attention and decision making skills – Rapid growth and development (sensitive period). Decrease in strength and power because of rapid growth. – Improved aerobic capacity – Deterioration in postural and balance skills (it is important to continue working on swimming skills at this age) – Greater potential of skeletal-muscular injuries POSTPUBERTY Age 16-19: – Appreciation of variety in training and swimming sets – Improvements in racing skills – Increased muscle mass and tolerance to the high-intensity work (anaerobic capacity) – Increased sprinting ability (strength and power) – Improved cardio-vascular system Sensitive Periods of Development Physical characteristics and physiological systems develop at different rates during maturation. During the adolescent growth spurt many parameters show accelerated growth size and strength. These accelerated phases of development are called “sensitive periods” and represent the fastest rate of development. 41 Anthropometric Parameters in Career Training (Swimmers) 190 185 Males 180 Females . 170 Height, cm 175 165 160 155 “Sensitive Periods” 150 145 140 10 12 14 Age, years 16 Timakova T.S., 1985 18 42 Changes in Height Gain Peak Height Velocity (Puberty) Initiation of Adolescent Spurt (Prepuberty) Deceleration (Postpuberty) 43 Changes in Weight Gain 10 9 Males 8 Females Peak Weight Velocity (Puberty) WG, kg/yr 7 6 5 4 3 Deceleration 2 Initiation of Adolescent 1 (Postpuberty) 0 Spurt (Prepuberty) 9 11 13 15 17 19 Age, years 44 Vo2 max in Young Male Athletes “Sensitive Period” 4500 4250 Vo2 (ml/min) 4000 3750 3500 3250 3000 Cunningham et al. (1987) 2750 Daniels et al. (1978) 2500 2250 Murase et al. (1981) 2000 Baxter-Jones et al. (1993) 1750 8 10 12 14 16 18 20 Age (yrs) 45 Changes in Aerobic Capacity Gain (Males) 1.8 VO2 max “Sensitive Periods” 1.6 O2 debt Parameters 1.4 Vital Capacity 1.2 1 0.8 0.6 0.4 0.2 0 11 12 13 14 Age 15 16 17 Kashkin A.A., 1981; Timakova T.S., 1985 46 Strength Parameters in Career Training (Swimmers, Males) “Sensitive Periods” Sokolovas G., Gordon S., 1986 47 Changes in Strength Gain (Males) 14 “Sensitive Periods” Gain of Strength, KG 12 Dryland Strength 10 Water Strength 8 6 4 2 0 12 13 14 15 16 17 18 19 Age Priluckij P.M., 1998 48 Arm Pull Vertical Jump 14 5 12 4 cm/yr kg/yr 10 8 6 3 2 4 2 1 -3 -2 -1 PHV 1 2 3 -3 Bent Arm Hang 6 -2 -1 PHV 1 2 3 Sit and Reach 2 2 0 cm/yr s/yrr 4 -3 -2 -1 PHV 1 2 1 3 -2 -4 0 -3 -2 -1 PHV 1 2 3 Data from Beunen et al., 1988 49 Progression of Physical Qualities in Career Training 100.0 90.0 Progression, % 80.0 70.0 60.0 50.0 Aerobic 40.0 Mix 30.0 Anaerobic-glycolitic Creatine phosphate 20.0 Specific power 10.0 0.0 10 12 14 16 Age 18 20 22 50 Duration of Sensitive Periods Physical Quality Boys (years) Girls (years) Flexibility Balance Agility Endurance Strength 7-13 9-11 10-12 12-14 14-16 6-12 8-10 9-11 11-13 13-15 51 Workload Progression in Career Training (Male) Total - 3,600,000 yrd Aerobic - 62% 100.0 Mix - 22% 90.0 80.0 Progression, % 70.0 Distance Swimmer Anaerobic - 5% CP - 1.5% Total - 2,700,000 yrd 60.0 Aerobic - 59% 50.0 Mix - 30% Sprinter 40.0 Anaerobic - 8% 30.0Total - 380,000 yrd CP - 3% 20.0Aerobic - 90% 10.0Mix - 7% 0.0Anaerobic - 2% 10- 1% 12 CP 14 16 Age 18 20 22 52 Workload Progression in Career Training (Male Sprinters) 3,000,000 2,500,000 Total Workload, yrd REC-EN1 2,000,000 EN2-3 1,500,000 1,000,000 500,000 0 9 11 13 15 Age 17 19 21 23 53 Workload Progression in Career Training (Male Sprinters) 250,000 SP1-2 200,000 SP3 Workload, yrd 150,000 100,000 50,000 0 9 11 13 15 Age 17 19 21 23 54 Dryland Workload Progression in Career Training (Male Sprinters) 8,000 7,000 General Strength (Weights) 6,000 Specific Strength (Biokinetic etc.) Min 5,000 4,000 3,000 2,000 1,000 0 9 11 13 15 Age 17 19 21 23 55 Total Swimming Workload Volume for Early, Normal, and Late Matured Swimmers 3,000,000 Normal Matured Early Matured Workload, yrd 2,500,000 Late Matured 2,000,000 1,500,000 1,000,000 500,000 0 8 10 12 14 Age 16 18 20 Stages of Career Training Preliminary Preparation Basic Training Specialization Peak Performance Maintenance of High Performance 57 Preliminary Preparation (Girls 7-9, Boys 8-10) Teaching of swimming technique in different swimming strokes Teaching of diving and turns Improvement of interest to compete Development of flexibility, general (aerobic) endurance, balance in water Playing & games method Recommended maximum number of sessions per week - 3-4 Recommended number of seasons - 3 (3 peak 58 performance competitions) Basic Training (Girls 10-12, Boys 10-13) Teaching of advanced swimming technique in different swimming strokes Evaluation of individual swimming stroke and distance orientation Development of aerobic and anaerobic-aerobic (mix) endurance Development of quickness and agility Beginning of development of general strength Recommended maximum number of sessions per week - 6-9 Recommended number of seasons in one year - 23 (2-3 peak performance competitions) 59 Specialization (Girls 12-17, Boys 13-18) Development of individual swimming technique Individualization of technical and racing tactics Development of aerobic-anaerobic mix, anaerobic specific endurance, and general strength Beginning of development of specific strength and speed Maintenance of flexibility Recommended maximum number of sessions per week - 9-12 Recommended number of seasons in a year - 2-3 (2-3 peak performance competitions) 60 Peak Performance (Girls 16-20, Boys 17-22) Perfection and stabilization of individual swimming technique, diving, turns, and tactical skills Development of distance specific endurance, specific power, transition of specific power to water Development of specific strength speed Maximization of workload volume Modeling (race simulation) of all conditions of competition Maintenance of individual flexibility Recommended maximum number of sessions during peak week - 12-15 Recommended number of seasons in a year - 2 (2 peak performance competitions) 61 Maintenance of High Performance (Girls 18 and older, Boys 20 and older) Maintenance of individual swimming technique, diving, turns, and tactical skills Maintenance of individual power, endurance, speed, and flexibility Reduction of total workload volume with increasing of intensity Maintenance of health Recommended maximum number of sessions per week - 9-12 Recommended number of seasons in a year - 2 (2 peak performance competitions) 62 Optimizing Long-Term Training Measure height at least twice a year. Increase workload volumes accordingly: 63 Optimizing Long-Term Training Identify early/late maturers: – Early maturers experience early success due to physical growth advantage – Early success does not predict later success – Late maturers often catch up and exceed the performance of early maturers – Keep success in perspective – Develop sets to monitor individual progression Optimizing Long-Term Training Evaluate distance orientation (sprint, middle distance, distance): Swimmer 1 Swimmer 2 Best Time on 100 Best Time on 200 Times in Seconds 00:54.50 01:57.70 54.5, 117.7 sec 00:55.00 02:02.10 55.0, 122.1 sec Calculation Ratio 200/100 117.7/54.5 2.16 122.1/55.0 2.22 Optimizing Long-Term Training Predict performance progression and make corrections in workload volumes/intensities: WINDOWS FOR 100 FREE MEN (LC) 01:19 1:19.90 01:15 1:10.65 01:11 1:04.67 TIME 01:07 1:00.41 01:02 1:01.70 00:58 0:57.31 0:54.99 0:58.99 0:53.23 0:56.85 00:54 0:51.87 0:55.13 0:53.72 00:49 0:52.57 0:51.62 0:50.80 0:50.83 0:50.16 0:49.95 0:49.28 0:48.74 0:49.61 0:49.14 0:48.74 00:45 11 12 13 14 15 16 17 YEARS 18 19 20 21 22 THANK YOU FOR YOUR ATTENTION! QUESTIONS?
