“plan,” “project,”
advertisement
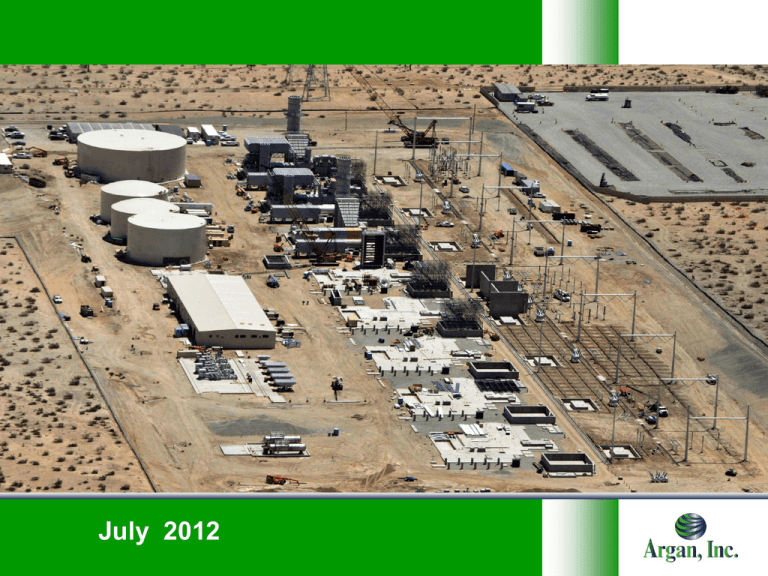
AGAN, INC. June 2010 June 2011 July 2012 Disclaimer All statements in this presentation that are not historical are forward-looking statements within the meaning of Section 21E of the Securities Exchange Act of 1934. Such forward-looking statements may be identified by words such as “believe,” “intend,” “expect,” “may,” “could,” “would,” “will,” “should,” “plan,” “project,” “contemplate,” “anticipate,” or similar statements. Because these statements reflect the current views of Argan, Inc. (“Argan” or the “Company”) concerning future events, these forward-looking statements are subject to risks and uncertainties. Argan’s actual results could differ materially from those anticipated in these forward-looking statements as a result of many factors, which are described under the caption “Risk Factors” in Argan’s most recent Forms 10-K and 10-Q filed with the Securities and Exchange Commission. Argan undertakes no obligation to update publicly any forwardlooking statements contained in this presentation. 2 Investment Highlights 3 Demonstrated track record of performance Substantial industry growth prospects Strong backlog and bidding pipeline Compelling financial characteristics Experienced management team Company Overview 4 Year founded – 1961 Headquarters – Rockville, MD Ticker – NYSE AMEX:AGX Market cap (7/12/12) – $198 million FY 2012 Revenue – $142 million FY 2012 EBITDA – $13 million Q-1 (4/30/12) Revenue - $64 million Q-1 (4/30/12) EBITDA - $7 million Employees – 400 Backlog at 4/30/12 - $358 million Senior Management Team 5 Rainer Bosselmann – Chairman and CEO Arthur Trudel – Chief Financial Officer Richard Deily – Corporate Controller Management has an established track record of creating value for the shareholders of Jupiter National, Inc. (AMEX:JPI), Arguss Communications, Inc. (NYSE:ACX) and Argan, Inc. (NYSE MKT:AGX) Senior Gemma Management Team 6 William F. Griffin, Jr. – Co-Founder & Chief Executive Officer Daniel L. Martin – President Bill and Dan have more than 60 years combined experience in all facets of engineering, detailed design, procurement, construction management and other support services in the building of power plants and renewable energy facilities. Business Overview Gemma Power Systems, LLC (“GPS”) – providesFY 2013 Q-1 Revenue by Subsidiary engineering, procurement and construction (“EPC”) services to power generation and 9% renewable energy markets – 7 GPS accounted for 91% of total revenues during the three months ended April 30, 2012 Southern Maryland Cable, Inc. (“SMC”) – provides telecommunications data infrastructure services 91% Industry Growth Drivers 8 Substantial capacity additions will be required to meet rising electricity demand The retirement of older and inefficient plants and coal-fired generation facilities will further drive investment in new gas fired generation capacity Federal and state legislation, subsequent to the Fall 2012 elections, is needed to support energy produced by renewable sources. Unless tax credits are renewed or new credits are passed, the number of renewable energy projects will be substantially diminished in the short run. Overview of GPS 9 Acquired by Argan – December 2006 – Purchase price – $33.1 million – $12.9 million in cash – $20.2 million from issuance of 3.7 million shares – Funded in part by $8.0 million secured four year amortizing term loan, which has been paid-in-full. Services – engineering, procurement and construction of natural gas fired and alternative power energy facilities Customers – utilities and independent power producers FY 2012 revenue: $133 million FY 2012 EBITDA: $16 million Q-1 FY 2013 Revenue - $58 million Q-1 FY 2013 EBITDA - $7 million Backlog at 4/30/12: $358 million Revenue and EBITDA Growth GPS’s revenue and EBITDA have remained strong since the acquisition by Argan in December 2006 Revenue for Years Ended January 31 * Represents 1st QTR FY2013 only $ 209.8 $ 202.3 $ 180.4 $ 174.9 $ 134.4 $ 132.5 $ 57.7 $100.0 $ 48.6 $31.2 $30.0 $20.0 $10.0 $3.8 $5.4 $16.8 $22.2 $17.2 $15.7 $7.3 20 06 20 07 20 08 20 09 20 10 20 11 *A 201 2 pr il 20 13 20 pr 12 il 20 13 *A 20 11 20 10 20 09 20 08 20 07 20 06 * Represents 1st QTR FY2013 only $0.0 $0.0 10 $40.0 ($ in millions) ($ in millions) $300.0 $200.0 EBITDA for Years Ended January 31 GPS Track Record 11 More than 12,000 megawatts of installed power plant capacity More than 850 megawatts of power facility development More than 350 million gallons per year of installed renewable fuels capacity 40 projects completed on an EPC basis 51 major turnkey construction projects Power experience includes combined cycle, combustion turbines, coal/wood fueled projects, wind plants, solar facilities and waste recovery facilities Renewable fuels experience includes bio-diesel and ethanol facilities National Footprint GPS has the ability to provide EPC services to customers throughout the United States Historical Project Locations 12 States in which GPS has completed projects. Extensive Project Portfolio 13 Power facilities – simple cycle solution – CPV Sentinel Energy Project – A.L. Pierce Re-powering Project – Vandolah Power Project – DeSoto County Power Project – Indigo Energy Facility – Larkspur Energy Facility – Richmond County Phase I Power – Monroe Power Project – Richland Peaking Project – Rocky Road Unit 4 Project – Broad River Energy Center – Middletown, CT Project Pollution solution – Brayton Point Power Station – La Rosita SCR Project Biomass Power Facility - Woodville, Texas Solar Facility Canton, MA Power facilities – combined cycle solution – Colusa Generating Station – Roseville Energy Park – Hines PB-2 Power Project – Rowan County Power Project – Effingham County Power Project – Richmond County Phase II Power Project Process facilities – biodiesel – Renewable BioFuels Port Neches – Galena Park – Green Earth Fuels Houston LLC Process facilities – ethanol – Carleton Ethanol Facility Wind Facilities LaSalle County, Illinois Vantage, Washington Henry County, Illinois Ebensburg, Pennsylvania Current Projects 14 CPV Sentinel Peaking Facility – Southern California Edison - design and construction of a natural gas fired power plant near Palm Springs, California – 800 megawatt single cycle facility – Contract value: $269 million – Commenced project: Spring 2011 – Expected completion: Summer 2013 Current Projects 15 East Texas Electric Cooperative, Inc. (ETEC) – Woodville, Texas – engineer-procure-construct (EPC) contract to design and build a 49.9 MW biomass-fired power plant. – Contract Value: $167 million – Commenced Project: May 2012 – Estimated Completion: December 2014 U.S. Natural Gas Development 16 Argan is participating in Marcellus Shale Region development activities with the object of developing large-scale power plants. The approach is to take principal positions in the initial stages of development, secure the rights for an EPC contract for the large scale power plant to be built on the development site. Argan then sells its equity interest in the site to the ultimate developer of the power plant. Wind Power Focus June 2008 - Formed business partnership with Invenergy Wind Management, LLC – Argan was the primary contractor for Invenergy sponsored construction of wind farms in the United States and Canada – During 3Q09 GPS substantially completed the expansion of a wind farm in LaSalle County, IL December 2009 – Gemma acquired remaining ownership of the wind power venture – 17 Leveraged GPS’ historical expertise in wind power Vantage Wind Energy awarded Gemma $33 million wind project in Washington State. November 2010 – Gemma awarded $59 million construction contract for a 200 MW project in Henry County, Illinois January 2012 – Gemma awarded $18 million construction contract for a 30 MW project near Ebensburg, Pennsylvania Current Wind Projects 18 Henry County Illinois – design and build a wind farm - Contract value: $62 million - Commenced project: November 2010 - Completion: Summer 2012 Ebensburg, Pennsylvania – design and build a wind farm - Contract value: $18 million - Commenced Project: January 2012 - Completion: December 2012 Recent Wind Projects LaSalle County, Illinois – design and build the expansion of existing wind farm – Contract value: $46 million – Commenced project: August 2008 – Completion: October 2009 Vantage, Washington - Contract value: $32 million - Commenced project: December 2009 - Completion: September 2010 19 Solar Power Focus 20 Canton, Massachusetts – design and build a 6 Mega Watt solar energy facility - Contract value: $16 million - Commenced project: November 2011 - Completion: Summer 2012 Competitive Landscape Larger Projects / Traditional Fuels 21 Smaller Projects / Alternative Fuels Growth Strategy 22 Establish additional strategic alliances in the EPC space Make additional strategic acquisitions that complement our unique market position Partner with well capitalized investment entities to create larger service opportunities in renewable energy projects Exploit long-term relationships throughout the industry to aggressively build backlog of traditional and renewable energy projects Make strategic investments in power plant development projects as a means to create greater opportunities to build backlog of large scale EPC contracts. Backlog Argan has significant contract backlog Historical Contract Backlog as of January 31 ** * April 30, 2012 2007 23 2008 2009 2010 2011 2012 2013 Investment Summary 24 Demonstrated track record of performance Substantial industry growth prospects Strong backlog and bidding pipeline Compelling financial characteristics Experienced management team Financials Consolidated Statements of Operations Three Months Ended April 30, 2012 Year Ended January 31, 2011 2012 2011 (unaudited) Net revenues Power industry services $ Telecommunications infrastructure services Net revenues 57,728,000 $ 14,019,000 $ 132,519,000 $ 174,938,000 5,962,000 63,690,000 1,974,000 15,993,000 9,331,000 141,850,000 7,654,000 182,592,000 48,984,000 10,481,000 111,193,000 146,976,000 4,605,000 53,589,000 10,101,000 3,028,000 7,073,000 (9,000 ) 1,614,000 12,095,000 3,898,000 2,759,000 1,139,000 22,000 7,555,000 118,748,000 23,102,000 11,186,000 11,916,000 48,000 6,493,000 153,469,000 29,123,000 12,129,000 16,994,000 50,000 Income from continuing operations before income taxes Income tax expense 7,064,000 2,517,000 1,161,000 416,000 11,964,000 4,556,000 17,044,000 7,037,000 Income from continuing operations 4,547,000 745,000 7,408,000 10,007,000 (405,000 ) 120,000 (65,000 ) (74,000 ) 282,000 1,280,000 (3,557,000 ) 1,324,000 (285,000 ) (139,000 ) 1,562,000 (2,233,000 ) 606,000 8,970,000 7,774,000 Cost of revenues Power industry services Telecommunications infrastructure services Cost of revenues Gross profit Selling, general and administrative expenses Income from operations Other (expense) income, net Discontinued operations Loss on discontinued operations (including gain on disposal of $1,312,000 in January 2012 and $152,000 in April 2011 Income tax benefit Loss on discontinued operations Net income 4,262,000 Less – Loss attributable to noncontrolling interest (variable interest entities) Net income attributable to Argan, Inc.stockholders 25 $ 176,000 4,438,000 $ -606,000 $ 302,000 9,272,000 $ -7,774,000 Financials Consolidated Statements of Operations, continued Earnings (loss) per share attributable to Argan, Inc. stockholders Continuing operations Basic Diluted $ $ 0.35 0.34 $ $ 0.05 0.05 $ $ 0.57 0.56 $ $ 0.74 0.73 Discontinued operations Basic Diluted $ $ (0.02 ) (0.02 ) $ $ (0.01 ) (0.01 ) $ $ 0.11 0.11 $ $ (0.16 ) (0.16 ) $ $ 0.32 0.32 $ $ 0.04 0.04 $ $ 0.68 0.67 $ $ 0.57 0.57 Net income Basic Diluted Weighted average number of shares outstanding Basic Diluted 26 13,663,000 13,950,000 13,601,000 13,679,000 13,612,000 13,792,000 13,593,000 13,709,000 Financials Reconciliation to EBITDA, Continuing Operations Three Months Ended April 30, 2012 Income from continuing operations Interest expense Income tax expense $ Amortization of purchased intangible assets Depreciation and other amortization EBITDA 27 $ 2011 4,547,000 12,000 2,517,000 $ 745,000 -416,000 61,000 87,000 117,000 7,254,000 117,000 1,365,000 $ Financials Reconciliation to EBITDA – Power Industry Services Three Months Ended April 30, Income before income taxes Interest expense $ Amortization of purchased intangible assets Depreciation and other amortization EBITDA 28 $ 2012 7,177,000 12,000 $ 2011 2,140,000 -- 61,000 87,000 58,000 7,308,000 49,000 2,276,000 $ Financials Consolidated Balance Sheets – April 30, 2012 & January 31, 2012 April 30, ASSETS CURRENT ASSETS: Cash and cash equivalents $ Accounts receivable, net of allowance for doubtful accounts 29 January 31, 2012 2012 (Unaudited) (Note 1) 175,309,000 $ 156,524,000 18,516,000 16,053,000 Costs and estimated earnings in excess of billings Deferred income tax assets Prepaid expenses and other current assets TOTAL CURRENT ASSETS 2,466,000 784,000 2,107,000 199,182,000 2,781,000 691,000 4,528,000 180,577,000 Property and equipment, net of accumulated depreciation ($2,413,000 and $1,469,000 related to variable interest entities as of April 30, 2012 and January 31, 2012, respectively Goodwill Intangible assets, net of accumulated amortization Deferred income tax and other assets TOTAL ASSETS 3,775,000 18,476,000 2,513,000 743,000 224,689,000 2,761,000 18,476,000 2,574,000 864,000 205,252,000 $ $ Financials Consolidated Balance Sheets, continued – April , 2012 & January 31, 2012 LIABILITIES AND STOCKHOLDERS’ EQUITY CURRENT LIABILITIES: Accounts payable Accrued expenses Billings in excess of costs and estimated earnings TOTAL CURRENT LIABILITIES Other liabilities TOTAL LIABILITIES $ 28,198,000 4,925,000 85,997,000 119,120,000 9,000 119,129,000 $ 29,524,000 6,751,000 68,004,000 104,279,000 10,000 104,289,000 STOCKHOLDERS’ EQUITY Preferred stock, par value $0.10 per share; 500,000 shares authorized;no shares issued and outstanding Common stock, par value $0.15 per share; 30,000,000 shares authorized;13,680,098 and 13,661,098 shares issued at April 30 and January 31, 2012 respectively, 13,676,865 and 13,657,865 shares outstanding at April 30 and January 31, 2012, respectively Warrants outstanding Additional paid-in capital Retained stock, earnings Treasury at cost; 3,233 shares at April 30, 2012 and January 31, 2012 TOTAL STOCKHOLDERS’ EQUITY Noncontrolling interest (variable interest entities) TOTAL EQUITY TOTAL LIABILITIES AND STOCKHOLDERS’ EQUITY Note 1: The condensed consolidated balance sheet as of January 31, 2012 has been derived from audited consolidated financial statements. 30 $ 2,052,000 576,000 90,060,000 13,381,000 2,049,000 590,000 89,714,000 8,955,000 (33,000 ) 106,037,000 (477,000 ) 105,560,000 224,689,000 (33,000 ) 101,264,000 (301,000 ) 100,963,000 205,252,000 $


