NOAA Presentation Na..
advertisement
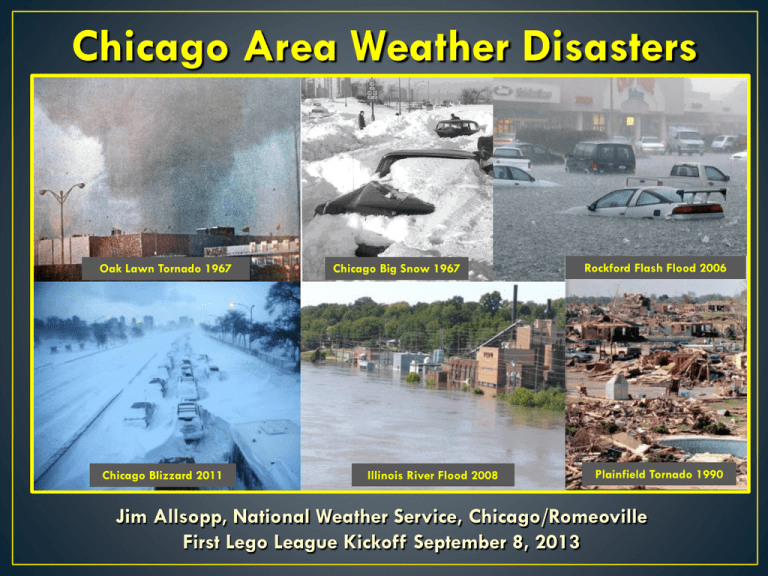
Chicago Area Weather Disasters Oak Lawn Tornado 1967 Chicago Blizzard 2011 Chicago Big Snow 1967 Illinois River Flood 2008 Rockford Flash Flood 2006 Plainfield Tornado 1990 Jim Allsopp, National Weather Service, Chicago/Romeoville First Lego League Kickoff September 8, 2013 • • • • • • • • • • Tornadoes River Floods/Flash Floods Lightning Hail Thunderstorm Winds Winter Storms Extreme Heat Extreme Cold Drought Lake Michigan – coastal flood, rip currents, seiche • Tornadoes occur anywhere in the Chicago metro area • Tornadoes can strike large cities – Ft. Worth, Miami, Nashville, Salt Lake City • Tornadoes occur at the lakefront Weak Tornado (70-75%) • EF0 – winds 65 to 85 mph • EF1 – winds 86 to 110 mph Strong Tornado (20-25%) • EF2 – winds 111 to 135 mph • EF3 – winds 136 to 165 mph Violent Tornado (<2%) • EF4 – winds 166 to 200 mph • EF5 – winds over 200 mph EF4 & EF5 cause 85% of tornado fatalities! • 10 Violent Tornadoes in 90 Years • • • • • • • • March 28, 1920 – F4, Melrose Park and Maywood April 7, 1948 – F4 Manteno, IL to Hebron, IN April 17, 1963 – F4 Essex & Bourbonnais, IL to Medaryville, IN April 11, 1965 (Palm Sunday) – F4 Crystal Lake April 21, 1967 – 3 F4s Belvidere, Lake Zurich, Oak Lawn March 20, 1976 – F4 Deep River to MI City, IN June 13, 1976 – F4 Lemont August 28, 1990 – F5 Plainfield • 10 tornadoes in the Chicago area • 3 F4 Tornadoes, 58 killed, 1000 injured • Part of a large outbreak across the Midwest • F4 • 25 mile path, ½ mile wide. • 24 fatalities, 500 injured • 13 fatalities and 300 injuries occurred as a dozen busses were tossed at Belvidere High School at school dismissal. • F4 • 16 mile path, 200 yards wide. • 33 killed, 500 injured • Struck busy intersection at 500 PM on a Friday afternoon. • • • • Lemont – Argonne Lab F4 3.3 mile path, 1 mile wide! 2 killed, 23 injured. • • • • Oswego – Plainfield – Joliet F5 16 mile path, 1/4 mile wide 29 killed, 350 injured • Only F5 ever in Chicago area • Only F5 in U.S. in August Plainfield • Late July Heat Wave in 1916 • July 26 -July 30 most oppressive period of heat ever in Chicago. • Min temp in the 80s for 5 straight nights! • 1930s Dust Bowl Summers • A series of hot dry summers in the 1930s. • June of 1933 - hottest June on record. • Chicago's official all time high of 105 set July 24 1934. (109 at Midway on July 23) • July 6 through 14, 1936 - eight 100s in a row at Midway. • July 14, 1936 - hottest day ever over northern IL. • 112 at Rockford, 111 at Aurora , 104 at Midway. • Hot Summers of the 1950s • 6 of 13 hottest summers1949-1959. • July 1955 - hottest month on record. • 1955 - Chicago’s all time hottest summer. • 46 days in the 90s including 11 straight (also in 1953 and 1954) • The Hot Dry Summer of 1988 • 47 days with temperatures in the 90s, 7 days in the 100s. Both records. • The Deadly Summer of 1995 • 629 people died in July heat wave. Deadliest weather event in Chicago history. • July 13 - 104 at O’Hare, 106 at Midway, Heat index 119 at O’Hare, 125 at Midway. • 2nd hottest summer on record. Jan 26-27 1967 Jan 12-14 1979 Jan 1-3 1999 Jan 31-Feb 2 2011 Snowfall (inches) 23.0 20.3 21.6 21.2 Liquid Equivalent (inches) 2.40 1.36 1.39 1.57 snow/liquid ratio 9.6 to 1 14.9 to 1 15.5 to 1 13.5 to 1 duration of accumulating snow (hours) ~29 ~38 ~54 ~40 peak wind gust (mph) 53 39 43 61 maximum snow depth (inches) 23 29 18 18 snow stayed on the ground through (number of days) March 9 42 days March 6 51 days January 23 21 days February 17 16 days temperatures after the storm Jan 28-29 low 15/high 28 low 20/high 30 Jan 15-16 low -19/high 9 low -2/high 22 Jan 4-5 low -9/high 5 low -16/high 18 Feb 3-4 low -6/high 16 low 5/high 25 • The Winter of 1903-1904 • The coldest winter on record. • January, 1912 • Second coldest January on record. • Record stretch of 10 days in a row with lows below zero. • 13 days below zero for the month. • Bitter Cold Christmas 1983 • Dec 22-25 temperature below zero for 100 consecutive hours. • Dec 24th low temp of -25, high of -11, coldest day in Chicago. • Record Cold January 20, 1985 • -27F. All time coldest temperature for Chicago. • October 9-11, 1954 • Torrential rain over northern Illinois resulted in record flooding. • Chicago rainfall for the 3 day period 6.72 inches. • August 14-15, 1987 • Record Salt Creek flood. 16,000 buildings affected. • Record rainfall 9.35 inches fell 9 PM August 13th - 3 PM August 14th. • O’Hare completely surrounded by water. Kennedy and Edens Expressways had 300 vehicles stranded in water up to 6 feet deep. • July 18-20 1996 • Record rainfall over southwest suburbs. • State 24 rainfall record of 16.94 inches at Aurora. • Record flood at 19 river gages - DuPage, Fox, Illinois. • September 2008 • Remnants of tropical storms Gustav and Ike brought torrential rainfall • Total Sep rainfall for Chicago was 13.63 inches. • Flooding caused the Brookfield Zoo to closed for the first time. • April 17-18, 2013 • 4 to 8 inches of rain on already saturated soil • Record river flooding on Des Plaines River, North Branch of Chicago River, and Illinois River • Illinois River dam damaged by barges. Marseilles flooded. • Very dry conditions leading up to the fire • Cold front with strong dry southwest winds October 8, 1871 • Almost everything made of wood – buildings, sidewalks, roads, piles of firewood for heating. Flammable shingles and tar roofs. • 300 killed, 100,000 homeless (1/3 of the population) • Peshtigo, Wisconsin Fire • Peshtigo Firestorm – wall of flame 1 mile high, 5 miles wide and moving 90 mph • 1500-2500 killed (greatest death toll for any US fire) • 1.2 million acres consumed • Fire generated a tornado that “threw rail cars and houses into the air”. • http://weather.gov/chicago • From menu on left “top news archives” 8/28/2013 First Lego League • Office tours Mon-Fri 800 AM – 430 PM • Open House Sep 21 900 AM to 300 PM
