Zone-Based Snowfall Verification
advertisement
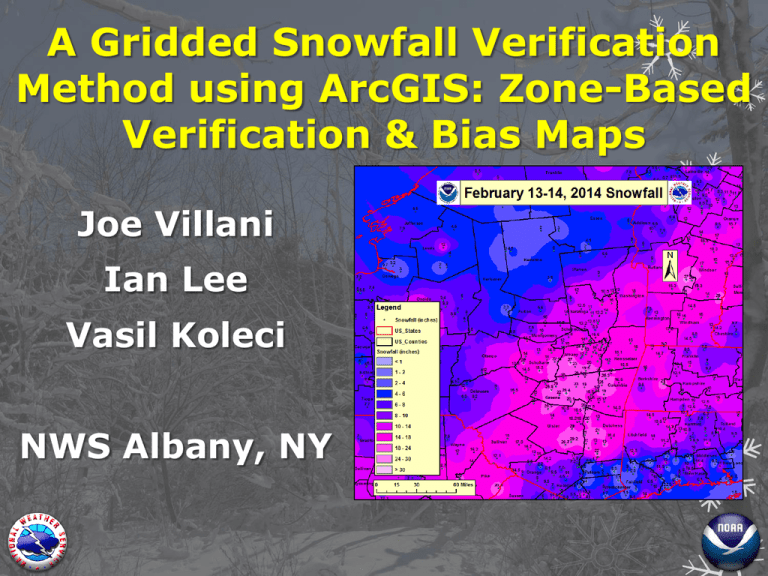
A Gridded Snowfall Verification Method using ArcGIS: Zone-Based Verification & Bias Maps Joe Villani Ian Lee Vasil Koleci NWS Albany, NY Motivation Utilize Geographic Information Systems (GIS) technology for a gridded and more representative snowfall verification method Legacy method (adding reports and dividing by # of reports) has become antiquated: Does not factor in spatial variability between data points Methodology Use ArcGIS 10.2 software ArcCatalog and ArcMap Create contoured snowfall maps and zonal statistics based on observations Methodology Careful QC of snowfall observations is necessary (from trained spotters, public, social media, etc.) Summary of reports issued as Public Information Statement (PNS) A Local Hydrometeorological Data Message (RRM) file is generated automatically from PNS Contains location name, snowfall amount, LAT/LON Methodology Important to have snowfall reports outside forecast area Allows for more representative interpolation Gather RRM files from surrounding offices Python script collects snowfall reports from RRM files and compiles them to a CSV file Import CSV file into a spreadsheet RRM File Example Relevant Data Extracted from RRM File Creation of Gridded Snowfall Map Generate GIS shape file of snowfall reports from spreadsheet using ArcCatalog Import into ArcMap Creation of Gridded Snowfall Map Run an Inverse Distance Weighting (IDW) function in ArcMap Can try other interpolation schemes such as Natural Neighbor or Spline Creates a gridded (raster) dataset and contoured snowfall map Color scheme can be matched to ER standardized forecast snowfall ranges Gridded (IDW) Snowfall Map IDW takes into account distance between points & interpolates Zonal Statistics Run Zonal Statistics (including mean) on the Gridded Map Image source: http://help.arcgis.com Verification by Forecast Zone A verification map is created using ranges corresponding to local office advisory & warning criteria Verification by Forecast Zone Run Zonal Statistics as a table for statistical values Output for Mean Snowfall and other stats within each forecast zone Verification Table is based on statistics computed from the Gridded (IDW) snowfall map Mean snowfall used for verification by forecast zone An Argument for the Gridded Method… Legacy method would result in mean snowfall skewed towards higher totals in eastern part of the zone where the snowfall reports are concentrated Gridded method more representative based on incorporating lower amounts west of the zone Creation of Forecast Bias Maps Preceding an event, export Forecast Snowfall from GFE to a netCDF file Script converts netCDF file to a shape file, Import into ArcMap and convert shape file to raster Creation of Forecast Bias Maps Create Gridded snowfall map from observations after event: Subtract Forecast – Observed to compute bias Creation of Forecast Bias Maps Forecast – Observed Snowfall = Bias Warm colors indicate over-forecast Cold colors indicate underforecast Conclusions This Gridded GIS-based verification method yields a more representative depiction of snowfall spatially across a region Aides in computing legacy zonebased verification in a more comprehensive manner Conclusions Used for official snow verification at ALY during the 2013-2014 winter season and ALY staff has given positive feedback Can be used in Social Media posts to give our users a graphical representation of snowfall after an event Conclusions Bias Maps show how well or poor a gridded forecast verified spatially Bias maps of snowfall events can be compiled over entire winter seasons to compute potential positive or negative biases Can be valuable for determining if certain areas consistently show a bias More Examples More Examples Acknowledgements John Quinlan – NWS Albany, providing conceptual ideas for computing zone average statistics Steve Welch – NWS Buffalo, method for creating shape file for snowfall based on reports and LAT/LON Luigi Meccariello – NWS Albany, assisting in creating observed snowfall maps during the 2013-2014 winter season Questions/Comments? Joe.Villani@noaa.gov Ian.Lee@noaa.gov Vasil.Koleci@noaa.gov
