Evaluation Overview Developmental Screening
advertisement
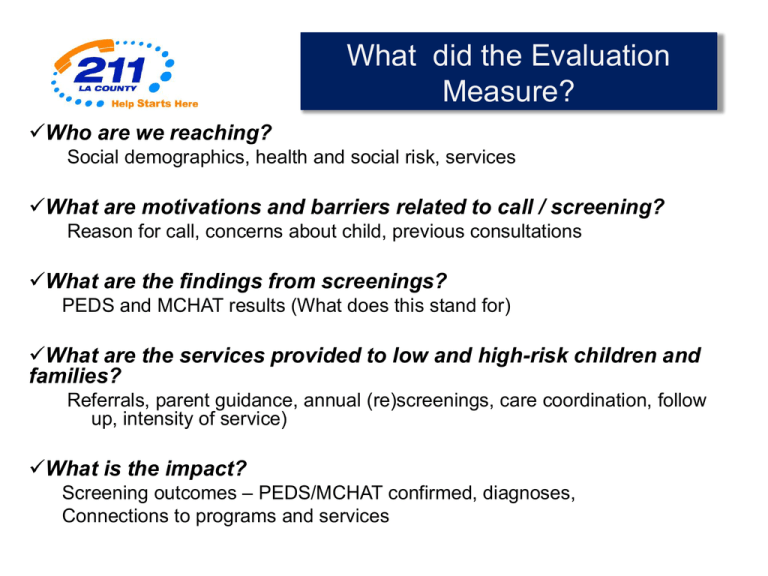
What did the Evaluation Measure? Who are we reaching? Social demographics, health and social risk, services What are motivations and barriers related to call / screening? Reason for call, concerns about child, previous consultations What are the findings from screenings? PEDS and MCHAT results (What does this stand for) What are the services provided to low and high-risk children and families? Referrals, parent guidance, annual (re)screenings, care coordination, follow up, intensity of service) What is the impact? Screening outcomes – PEDS/MCHAT confirmed, diagnoses, Connections to programs and services What are the Key Findings? Most callers with young children do not have developmental concerns. Care Coordination successfully connects children at high and moderate risk to assessment and developmental services. Children at low risk are receiving referrals to early childhood support services. What are the Key Components? 1. 2. Identification and Screening Intervention Guidance Referrals to programs and services Care coordination 3. Follow up Connection to services Outcomes for children with positive screens 4. System Improvement/Transition to sustainability Partnership development Dissemination 5. Data Support Measures and data collection Systems Analysis Data and System Evolution • Data in 4 separate systems. • No standard unique ID. • MS Access Form. • Paper files Sept 2009 – March 2010 • Development of measures. • Cyclic quality improvement program and data. • 211 LinQ Care Coordination module. • Automated processes and functionality • Integrated with 211 LinQ IT Team • Model for expansion and integration April 2010 – October 2011 April 2011 – November 2011 Coming soon May 2012 Who are we Reaching? • “In-reach” targets children 0-5 among larger pool of 500,000 callers annually. • • • • • • 28% have children 0-5 years at home. 91% female 37% with only a high school education or less 65% Hispanic; 2 in 5 Spanish as primary language 25% African-American 20% uninsured (80% qualify for Medi-Cal) • Half have low incomes (<1,000 /mo.) and half are unemployed • Many utilizing public resources Who is getting screened? White Hispanic 5% Black 15.4% 74% Who is getting screened? Children and families screened: • Calling for assistance with basic needs 37% • Female 95% • Single-parents 50%. • Children with health insurance 90.5% • Children with Medi-Cal coverage 82% • Children uninsured 7.4% • One or two children 5 or younger 84% *Reasons are among all callers referred for developmental screening Reasons for Calling • • • • • • • Child development concerns 11.8% Early childhood education 11.3% Child care 8.1% Prior child development concern 28% Sought previous help 17% Sought help from a medical provider 15% Expressed concern more likely to screen at highest risk (Path A=37% and failed M-CHAT 38%). *Reasons are among all callers referred for developmental screening Who are we Reaching? Callers with children 0-5 Offered Screening 10.9% 84,000 1 4,137 Interested 70% accept offer 2 2,896 1 211 LA annually 2 based on 10 month record review Screening Capacity in 2011 500 450 400 350 300 250 200 150 100 50 0 Interested Missed Screened PEDS Result Two and onePEDS halfResults times the Screening National Average Number Percent National Standardization High Risk (Path A) 942 27% 11% Moderate Risk (Path B) 934 27% 26% Low Risk Behavioral Guidance (Path C) 637 18% 20% Low Risk (Path E) 972 28% 43% Total 3,485 Autism (M-CHAT) TwoScreening Times For Children 16 to 48 months M-CHAT Screening Number National Average Percent September 2009 – October 2011 Fail 384 20% Pass 1,576 80% Total 1,605 M-CHAT standardized study screened 4,797 children 466 Fail Data from September 2009 through March 26, 2012 9.7% Families who Consulted Medical Provider * Medical Provider Actions: Risk: Highest Moderate Low Provider Not Concerned 61 21.1% 71 24.6% 21 7.3% 83 28.7% 53 18.3% 289 32 24.8% 32 24.8% 17 13.2% 30 23.3% 18 13.9% 129 Advised “Wait and See” / No Action Provided Information Referral to Regional Center, School District, or CBA Referral to Specialist Total Sought Medical Provider Assistance (*15% of September screened) Data from 2009 through March 26, 2012 8 24.2% 9 27.3% 12 36.4% 4 12.1% 2 6.1% 33 What Services are Provided to Families? Referrals and Care Coordination • 4,606 referrals to different intervention programs • 90.3% of children received a referral in one category • 30.6% had referral in two categories. • 25% of children were enrolled into one or more intervention services • 30.6% were connected to referrals or had applications pending • 38.6 % children low risk scheduled for annual re-screening Program and Service Referrals Primary Referrals Number Percent Head Start Preschool Program Early Head Start Program 962 702 30.7% 22.4% Early Childhood Education Program School District –Special Education Early Childhood Mental Health Program (Child Guidance) Regional Center (over 3 years of age) (Developmental Assessment) Early Start Program at Regional Center Parenting Skills/Training Pediatric Well Baby/Child Follow-up LAUP Preschool (4 years of age) 350 360 194 11.2% 11.5% 6.2% 133 4.2% 153 48 59 36 4.9% 1.5% 1.9% 1.1% 40 92 7 1.3% 2.9% 0.2% Hearing and Speech Evaluation Follow-up Developmental Screening Low Incidence referral to LACOE-EISS Program and Service Referrals for Children with a Positive Autism Screening Primary Referral Categories Positive Autism Screening % Head Start Preschool Program 17.1 Early Head Start Program 7.0 Early Childhood Education Program 2.8 School District –Special Education 13.0 Early Childhood Mental Health Program (Child Guidance) 3.5 Early Start Program at Regional Center (0-36 months) 19.9 Regional Center (over 3 years of age) (Developmental Assessment) Pediatric Well Baby/Child Follow-up 33.9 Hearing and Speech Evaluation 0.3 0.6 Program and Service Referrals for Children with a Positive Autism Screening Primary Referral Categories Positive Autism Screening % Head Start Preschool Program 17.1 Early Head Start Program 7.0 Early Childhood Education Program 2.8 School District –Special Education 13.0 Early Childhood Mental Health Program (Child Guidance) 3.5 Early Start Program at Regional Center (0-36 months) 19.9 Regional Center (over 3 years of age) (Developmental Assessment) Pediatric Well Baby/Child Follow-up 33.9 Hearing and Speech Evaluation 0.3 0.6 Impact of Care Coordination Outcomes to date for 3,485 children: Intervention Received – All Referrals Intervention Received – One or More Referrals Connected to Recommended Referrals / Application for Service in Progress Low Risk-Scheduled for Annual Rescreening Unknown Outcome After Follow-up Conducted Number Percent 258 610 7.4% 17.5% 1066 30.6% 1343 38.6% 204 5.9% Effectiveness of Care Coordination Outcomes to date for 3,485 children: Accumulated to date for 3485 children: Intervention Received – All Referrals Intervention Received – One or More Referrals Connected to Recommended Referrals / App in Process Low Risk-Scheduled for Annual Re-screening Unknown Outcome After Followup Conducted Risk Level Highest Moderate Low % % % 13.1 12.8 1.0 28.9 28.4 4.7 39.8 42.7 3.0 1.9 1.6 89.7 11.6 8.1 1.2 211 LA Developmental Screening Partner Network Signed MOUs • LA County Office of Education- Special Education Division • LA County Office of Education- Head Start State Preschool • Child Development Institute • Comprehensive Autism Related Education, Inc. (CARE) • El Nido Family Services -Early Head Start Program • South Central Los Angeles Regional Center • Children’s Institute, Inc. - Early Head Start and Head Start Program • The Alliance for Children’s Rights-Early Steps Initiative • Kedren Community Health Center - Early Head Start/Head Start and State Preschool • Human Services Association –Early Head Start Program • Montebello Unified School District – Head Start Program • Eisner Pediatric & Family Medical Center MOUs in Progress • Los Angeles County - Perinatal Mental Health Task Force • USC –School of Early Childhood Education – Early Head Start and Head Start Program • Training and Research Foundation Head Start Program • Los Angeles County Public Health –Child Health and Disability Prevention Program (CHDP) • Los Angeles County Public Health –Maternal, Child and Adolescent Health Programs • Los Angeles County Office of Child Care- STEP for Excellence Program • Magnolia Community Initiative Collaborators • Health Communication Research Laboratory, Washington University in St. Louis, St. Louis Missouri –research collaboration with 2-1-1s across the USA to eliminate health disparities • ZERO TO THREE - Policy Partner • Help Me Grow – 211 LA is a member of the HMG California Learning Consortium • Magnolia Place Community Initiative- Strengthening Families through the promotion of protective factors. 211 LA is a member of the Magnolia multisystem network and connects children that are screened and their parent/caregivers to the local initiative • Los Angeles County Perinatal Mental Health Task Force - working on grant with 211 LA to conduct maternal depression screening • Lucile Packard Foundation – 211 LA is a member of the California Collaborative for Children with Special Health Care Needs Questions Going Forward? What proportion of callers with stated concerns vs. none accept screening offer and are screened? Currently a small proportion of parents have stated (or previous) concerns; is that changing over time? Opportunities to reduce missed opportunities among clients with stated concerns, e.g., increased warm transfers? How is the intensity of service changing over time as measured by the number of transactions required to connect families to services? What children and families require more assistance; how can inreach be used to increase chances of finding them? Questions Going Forward? What factors are related to outcomes; differences between risk factors or groups? What is best way to measure connections for low risk children? System and program improvements resulting from collaboration with 211 Developmental Screening Project? Opportunities for using technology and agreements to improve the exchange of outcome information and consent, e.g., telephonic signature, portals? Additional opportunities to link DSP with related efforts (national and local), e.g., research re: the value of screening, theory and practice re: family strengthening and protective factors, and expanded screening? Developmental Screening Call Mapping Warm Transfer with Stated Concern Initial Call, Request for Service Community Resource Advisor Offers the Screening Warm Transfer to Care Coordinator
