PowerPoint Presentation - Steinberg Asset Management, LLC
advertisement
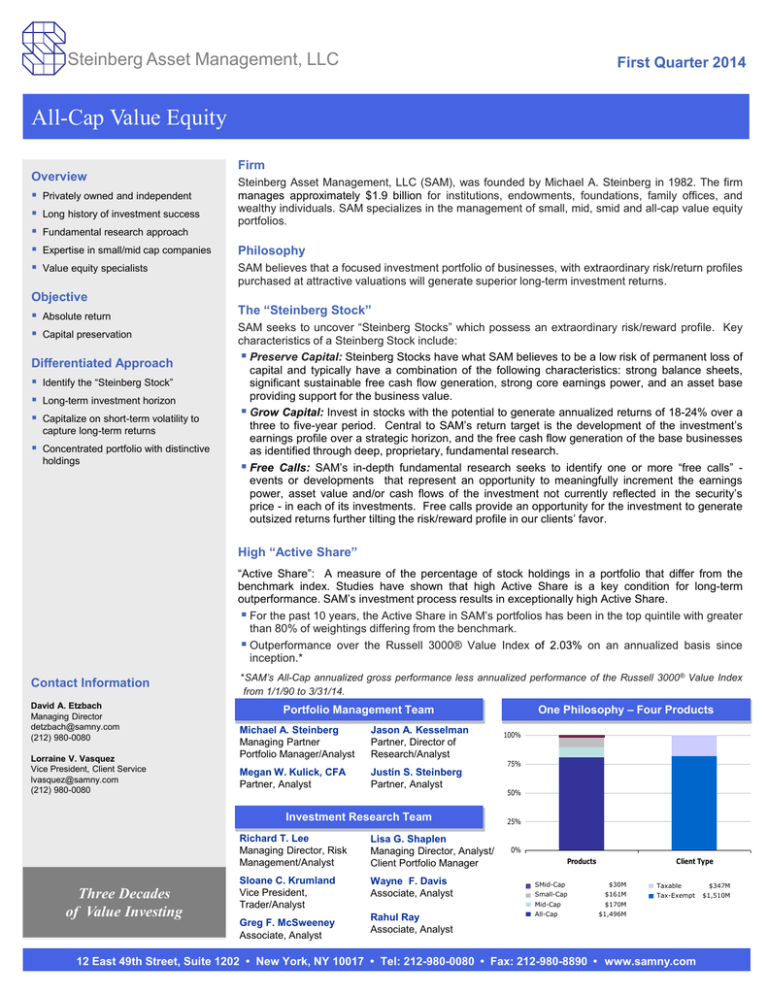
Steinberg Asset Management, LLC First Quarter 2014 All-Cap Value Equity Overview Privately owned and independent Long history of investment success Fundamental research approach Expertise in small/mid cap companies Value equity specialists Objective Absolute return Capital preservation Differentiated Approach Identify the “Steinberg Stock” Long-term investment horizon Capitalize on short-term volatility to capture long-term returns Concentrated portfolio with distinctive holdings Firm Steinberg Asset Management, LLC (SAM), was founded by Michael A. Steinberg in 1982. The firm manages approximately $1.9 billion for institutions, endowments, foundations, family offices, and wealthy individuals. SAM specializes in the management of small, mid, smid and all-cap value equity portfolios. Philosophy SAM believes that a focused investment portfolio of businesses, with extraordinary risk/return profiles purchased at attractive valuations will generate superior long-term investment returns. The “Steinberg Stock” SAM seeks to uncover “Steinberg Stocks” which possess an extraordinary risk/reward profile. Key characteristics of a Steinberg Stock include: Preserve Capital: Steinberg Stocks have what SAM believes to be a low risk of permanent loss of capital and typically have a combination of the following characteristics: strong balance sheets, significant sustainable free cash flow generation, strong core earnings power, and an asset base providing support for the business value. Grow Capital: Invest in stocks with the potential to generate annualized returns of 18-24% over a three to five-year period. Central to SAM’s return target is the development of the investment’s earnings profile over a strategic horizon, and the free cash flow generation of the base businesses as identified through deep, proprietary, fundamental research. Free Calls: SAM’s in-depth fundamental research seeks to identify one or more “free calls” events or developments that represent an opportunity to meaningfully increment the earnings power, asset value and/or cash flows of the investment not currently reflected in the security’s price - in each of its investments. Free calls provide an opportunity for the investment to generate outsized returns further tilting the risk/reward profile in our clients’ favor. High “Active Share” “Active Share”: A measure of the percentage of stock holdings in a portfolio that differ from the benchmark index. Studies have shown that high Active Share is a key condition for long-term outperformance. SAM’s investment process results in exceptionally high Active Share. For the past 10 years, the Active Share in SAM’s portfolios has been in the top quintile with greater than 80% of weightings differing from the benchmark. Outperformance over the Russell 3000® Value Index of 2.03% on an annualized basis since inception.* Contact Information David A. Etzbach Managing Director detzbach@samny.com (212) 980-0080 Lorraine V. Vasquez Vice President, Client Service lvasquez@samny.com (212) 980-0080 *SAM’s All-Cap annualized gross performance less annualized performance of the Russell 3000® Value Index from 1/1/90 to 3/31/14. Michael A. Steinberg Managing Partner Portfolio Manager/Analyst Jason A. Kesselman Partner, Director of Research/Analyst Megan W. Kulick, CFA Partner, Analyst Justin S. Steinberg Partner, Analyst Investment Research Team Three Decades of Value Investing One Philosophy – Four Products Portfolio Management Team Richard T. Lee Managing Director, Risk Management/Analyst Lisa G. Shaplen Managing Director, Analyst/ Client Portfolio Manager Sloane C. Krumland Vice President, Trader/Analyst Wayne F. Davis Associate, Analyst Greg F. McSweeney Associate, Analyst Rahul Ray Associate, Analyst 100% 75% 50% 25% 0% Products SMid-Cap Client Type $30M Small-Cap $161M Mid-Cap $170M All-Cap Taxable Tax-Exempt $1,496M 12 East 49th Street, Suite 1202 • New York, NY 10017 • Tel: 212-980-0080 • Fax: 212-980-8890 • www.samny.com $347M $1,510M Steinberg Asset Management, LLC First Quarter 2014 See our website www.samny.com for fully compliant GIPS® presentations. Performance History (Figures as of the period ending 3/31/14) All-Cap Value Equity (%) Annualized 1Q14 SAM All-Cap Value Equity (Gross) SAM All-Cap Value Equity (Net) 0.0% YTD 1 Yr 3 Yrs 5 Yrs 0.0% 20.8% 12.0% 21.4% 7 Yrs 10 Yrs 15 Yrs 5.2% 9.3% 12.3% -0.2 -0.2 20.0 11.3 20.6 4.5 8.6 11.7 Russell 3000 Value Index 2.9 2.9 21.7 14.6 21.9 4.8 7.6 6.7 S&P 500 Index 1.8 1.8 21.9 14.7 21.2 6.3 7.4 4.5 ® *Inception: 1/1/90 Sector Allocation Top Ten Holdings Company Weighting(%) Golar LNG Ltd Alere Inc Visteon Corp Arch Capital Group Ltd Actavis Plc Charter Communications-A Thermo Fisher Scientific Inc Monsanto Co Ebay Inc Jarden Corp 7.1% 5.2 4.7 4.4 3.7 3.3 3.1 3.0 3.0 3.0 All-Cap Value Equity Statistics Beta 0.93 2 0.86 R Sharpe Ratio Characteristics Summary Price/Cash Flow Price/Book Dividend Yield Median Market Capitalization SAM 10.4x 2.40x 1.50% 7.66B 1.37 Russell 3000® Value 10.8x 1.77x 2.22% $1.26B Russell 3000® Value All-Cap Value Equity Consumer Discretionary 23.4 6.7 Energy 19.4 14.0 Health Care 19.2 12.8 Information Technology 11.4 9.1 Industrials 7.4 10.4 Financials 7.3 29.9 Materials Telecomm Service 6.7 0.7 3.1 2.3 Consumer Staples 0.0 5.6 Utilities 0.0 6.1 All information except Beta, R2, and Sharpe Ratio is from a representative account in the composite. Beta, R2 and Sharpe Ratio are computed using the monthly composite returns for the historical five-year period ending 3/31/14. The securities in the Top Ten Holdings list should not be deemed as a recommendation to buy the specific securities in the list and do not represent all the securities purchased or sold and it should not be assumed that investments in these securities were or will be profitable. A listing of our 13(f) securities is filed with the SEC on Form 13F, please contact Steven Feld if you would like a copy of the last filed form. This information is shown as supplemental information only and complements the disclosures which appear at the bottom of this page. SAM has established a Partner Participation Plan with Jason Kesselman, Megan Kulick and Justin Steinberg as Partners. The Plan gives Partners a guaranteed portion in the profits of the firm on an annual basis. Additional Partners may be named under the Plan in the future. PERFORMANCE DISCLOSURE SAM is an SEC registered investment advisor. For purposes of GIPS, the firm is defined as all portfolios managed by SAM, including assets managed by Steinberg India Asset Management, Ltd., a wholly owned affiliate. All composite accounts were invested using the same “value” investment philosophy now employed at SAM. Historic performance is no guarantee of future performance, profitability, or the avoidance of losses. The All-Cap Value Equity composite was created in January 2000 and incepted on January 1, 1990. The composite was created to reflect all portfolios managed with a similar mandate. The composite contains concentrated, commission-paying, non-taxable value equity accounts managed using a bottom-up, fundamental investment approach and each with a market capitalization focus of holdings consistent with the composite name. All accounts are included in the composite unless: (a) the account size is less than $250,000; or (b) the account was not in place on the first day of the calendar quarter following its start date; or (c) the client has not given full investment discretion over the account. Both gross and net results include the reinvestment of dividends and income and are gross of custody fees but net of transaction costs. Withholding tax on dividends is treated as a reduction of the security’s dividend income for companies not domiciled in the U.S. Withholding tax on U.S. equities held by non-domestic accounts is treated as a cash withdrawal. Returns include the effect of foreign currency exchange rates. Composite performance is presented net of foreign withholding taxes on dividends, interest income, and capital gains. Withholding taxes may vary according to the investor’s domicile. Net performance reflects the deduction of actual advisory fees. Other expenses, such as custody fees, which the investors may have incurred independently, may have further reduced investors’ actual results. A percentage of the composite may be invested in non-U.S. securities. The currency used to calculate performance is the U.S. dollar. Additional information regarding policies for valuing portfolios, calculating performance, and preparing compliant presentations as well as a complete list of SAM’s composite descriptions is available upon request. SAM’s investment management fee schedule is 1.00%. Actual investment advisory fees incurred by clients may vary. Non-commission portfolios generally incur fees, e.g. ‘wrap fees’ charged separately by the plan sponsor and are included in net of fee performance calculations. SAM’s All-Cap Value Equity composite is compared to the Russell 3000® Value Index. For additional information, the composite has also been compared to the S&P 500 Index. The Russell 3000® Value Index is a hypothetical and unmanaged index compiled by the Frank Russell Company. The S&P 500 Index is a hypothetical and unmanaged index compiled by Standard and Poor’s. Both indices are weighted by market capitalization and their returns include the reinvestment of dividends. The indices do not account for transaction costs or other expenses which an investor might incur in attempting to obtain such returns. The Russell and S&P indices are taken from published sources and deemed reliable. Russell Investment Group is the source and owner of the Russell Index data contained or reflected in this material and all trademarks and copyrights related thereto. The presentation may contain confidential information and unauthorized use, disclosure, copying, dissemination or redistribution is strictly prohibited. This is a presentation of SAM. Russell Investment Group is not responsible for the formatting or configuration of this material or for any inaccuracy in SAM’s presentation thereof. The composite may differ significantly from the relevant performance benchmarks. Specifically, the composite may invest in fewer companies, and have significantly different industry exposure. The annual composite dispersion presented is an assetweighted standard deviation calculated for the accounts in the composite the entire year. Steinberg Asset Management, LLC claims compliance with the Global Investment Performance Standards (GIPS®) and has prepared and presented this report in compliance with the GIPS standards. Steinberg Asset Management, LLC has been independently verified for the period January 1, 1992 through December 31, 2012. Verification assesses whether (1) the firm has complied with all the composite construction requirements of the GIPS standards on a firm-wide basis and (2) the firm’s policies and procedures are designed to calculate and present performance in compliance with the GIPS standards. The All-Cap Value Equity composite has been examined for the period January 1, 1995 through December 31, 2012. The verification and performance examination reports are available upon request.
