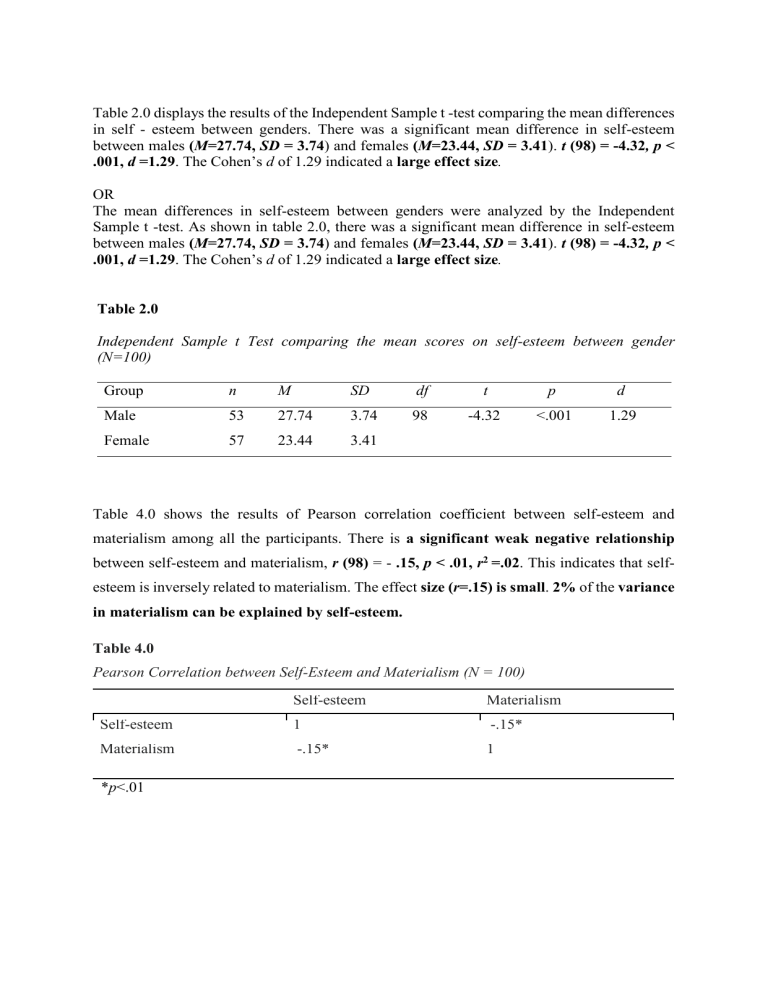
Table 2.0 displays the results of the Independent Sample t -test comparing the mean differences in self - esteem between genders. There was a significant mean difference in self-esteem between males (M=27.74, SD = 3.74) and females (M=23.44, SD = 3.41). t (98) = -4.32, p < .001, d =1.29. The Cohen’s d of 1.29 indicated a large effect size. OR The mean differences in self-esteem between genders were analyzed by the Independent Sample t -test. As shown in table 2.0, there was a significant mean difference in self-esteem between males (M=27.74, SD = 3.74) and females (M=23.44, SD = 3.41). t (98) = -4.32, p < .001, d =1.29. The Cohen’s d of 1.29 indicated a large effect size. Table 2.0 Independent Sample t Test comparing the mean scores on self-esteem between gender (N=100) Group n M SD df t p d Male 53 27.74 3.74 98 -4.32 <.001 1.29 Female 57 23.44 3.41 Table 4.0 shows the results of Pearson correlation coefficient between self-esteem and materialism among all the participants. There is a significant weak negative relationship between self-esteem and materialism, r (98) = - .15, p < .01, r2 =.02. This indicates that selfesteem is inversely related to materialism. The effect size (r=.15) is small. 2% of the variance in materialism can be explained by self-esteem. Table 4.0 Pearson Correlation between Self-Esteem and Materialism (N = 100) Self-esteem Materialism Self-esteem 1 -.15* Materialism -.15* 1 *p<.01 The association between gender and CGPA category was analyzed using a Chi-square test. Table 4.0 shows that there is no significant association between gender and CGPA category, 𝜒 2 (2, N =105) =.42, p > .07, Crammer’s V =.06. The effect size is small. Table 4.0 Chi-square correlation between gender and CGPA. (N=105) CGPA High Average Low 𝜒2 p Effect Size, V Male 9 9 7 .42 .07 .06 Female 26 26 28

