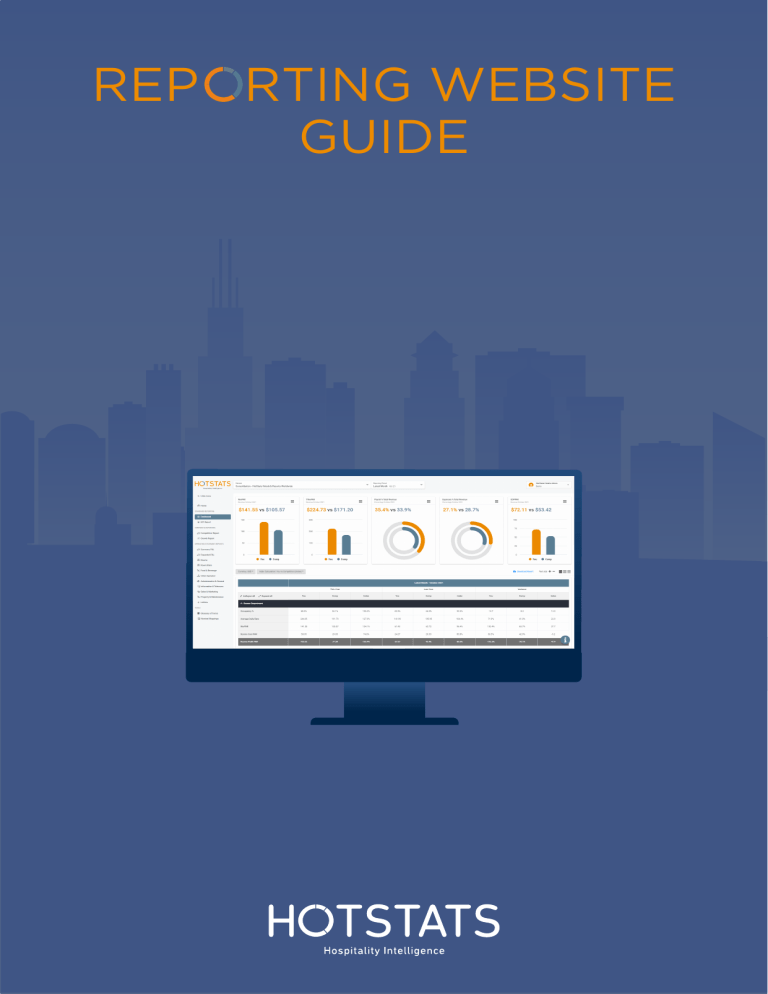
REP RTING WEBSITE GUIDE REPORTING WEBSITE LANDING PAGE Menu Access different areas of the reporting site Blog Posts Info Read all the latest industry related Find a video guide and interactive user news on the HotStats Blog. guides to help navigate the site. REPORTING WEBSITE MENU 1. Standard Reporting: Includes the Dashboard and KPI report. Use this section to get a quick look at your property’s performance. The KPI report is fully customizable. 2. Corporate Reporting: Includes the Competitive and Growth reports. Use this section to compare the performance of your competitive sets across a variety of KPIs. Both reports are fully customizable. 3. Operating Statement Reports We present full detail for the first nine schedules in the USALI 11th ed. including revenues, cost of sales, labor costs and other expenses. 4. Tools: Includes a Glossary of Terms and Nominal Mappings. REPORTING WEBSITE DASHBOARD Chart Menu Download your chart in PNG / Incease (+) or decrease (-) JPG / SVG or PDF Format. the text size to improve the report's readability. Choose the line spacing that works best for you. REPORTING WEBSITE DASHBOARD Select your Dataset Select the dataset highlighted Your Compset in orange in the hierarchy to Review your hotel compset. apply settings. KPI REPORTS The KPI report allows you to easily track and analyze the most relevant KPIs in your property. Click here to change the data set Click here to change the reporting period Click here to create a new KPI report. CREATING A KPI REPORT To create the report - select the department. Choose available metrics based on filters. COMPETITIVE REPORT Select data sets and click Next Step. CREATING A KPI REPORT After selecting KPIs click save and name the report. COMPETITIVE REPORT Click to create a new report. When you create a report in one of the two categories, it will also be included in the other. COMPETITIVE REPORT Select up to 10 KPIs for your report by choosing the department, the filters, and the ratios. COMPETITIVE REPORT Save as a new report and give your report a name. COMPETITIVE REPORT By clicking in the cell for You, Comp, or Index, you will see TY (this year) and LY (last year). To easily identify the performance areas to improve or to build upon. Indices above 100% are highlighted in green and indices below 100% are highlighted in red, to easily identify the performance areas to improve. GROWTH REPORT When a Competitive Report is created, the same criteria is used to automatically create the Growth Report. Indices above 100% are highlighted in green and indices below 100% are highlighted in red, to easily identify the performance areas to improve. Click in the Index cell to see TY (this year) and LY (last year). OPERATING STATEMENT REPORTS Select dataset for report Select how you want to see ratios. Default, PAR, POR or % Total Revenue. Click on the 3 dots to select the ratio for an individual line. Select reporting periods OPERATING STATEMENT REPORTS Click on any line of the report to display the Seasonality and Moving Average graphs. Click on Nominal Mapping to see what items from your P&L are mapped into the line. Click on Glossary to see the definition for the line item. GLOSSARY OF TERMS NOMINAL MAPPINGS Select an item under the USALI Structure to see what items are mapped there.
