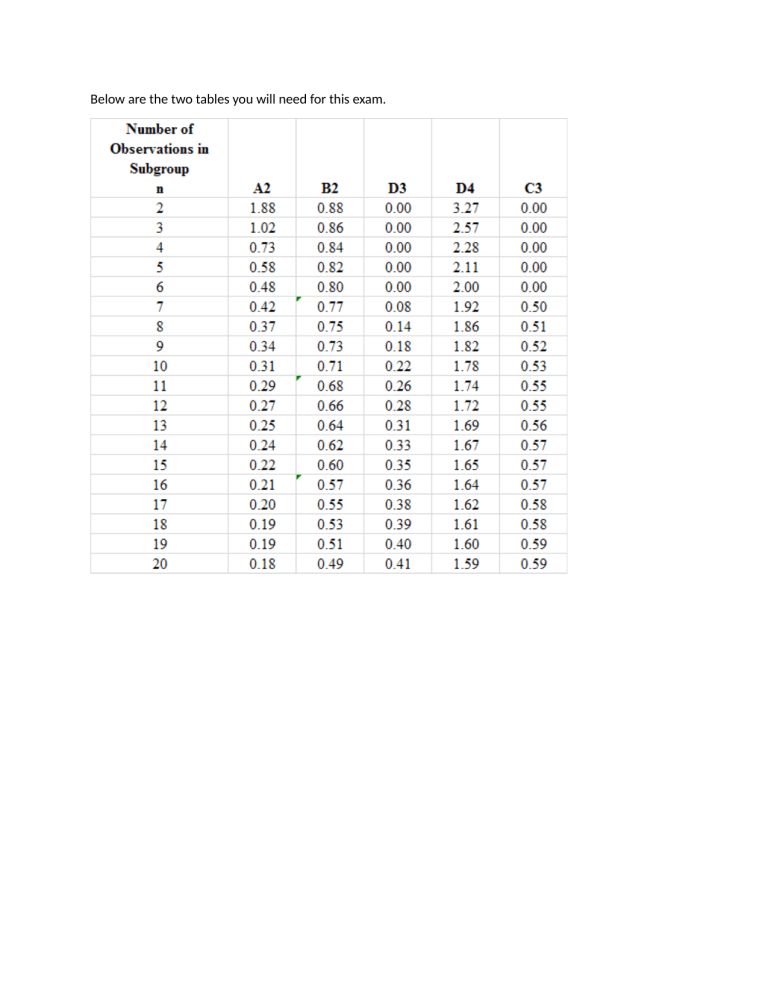
Below are the two tables you will need for this exam. X-Bar Control Chart Use the data below to work the problems in the next two sections. Note that each sample has a size of 20, e.g. n=20. Question 1 What is the value for A2? 1 / 1 point Answer: 0.18 Hide Feedback If you got this wrong, nothing else will be correct. Question 2 1 / 1 point What is the lower control limit? Answer: 3.99 Hide Feedback Question 3 What is the center line? Answer: 1 / 1 point 4.01 Hide Feedback Question 4 What is the upper control limit? Answer: 4.04 Hide Feedback 1 / 1 point Question 5 1 / 1 point Point 1 is out-of-control. True False Hide Feedback Question 6 1 / 1 point Point 2 is out-of-control. True False Hide Feedback Question 7 1 / 1 point Point 3 is out-of-control. True False Hide Feedback Question 8 1 / 1 point Point 4 is out-of-control. True False Hide Feedback Question 9 1 / 1 point Point 5 is out-of-control. True False Hide Feedback Question 10 Point 6 is out-of-control. True False Hide Feedback 1 / 1 point Range Control Chart Use the data from the prior section. Question 11 1 / 1 point What is the value for D3? Answer: 0.41 Hide Feedback If you get this wrong, the remainder of the problem will be wrong. Question 12 What is the value for D4? Answer: 1.59 Hide Feedback 1 / 1 point If you get this wrong, the remainder of the problem will be wrong. Question 13 1 / 1 point What is the lower control limit? Answer: 0.07 Hide Feedback Question 14 What is the center line? Answer: 0.16 Hide Feedback 1 / 1 point Question 15 What is the upper control limit? Answer: 0.26 Hide Feedback 1 / 1 point Question 16 1 / 1 point Point 1 is out-of-control. True False Hide Feedback Question 17 Point 2 is out-of-control. True False Hide Feedback 1 / 1 point Question 18 Point 3 is out-of-control. True False Hide Feedback 1 / 1 point Question 19 Point 4 is out-of-control. True False Hide Feedback 1 / 1 point Question 20 Point 5 is out-of-control. True False Hide Feedback 1 / 1 point Question 21 Point 6 is out-of-control. True False Hide Feedback 1 / 1 point p-Chart Using the following sample data and three sigma, determine the UCL, center line, and LCL for a p-chart and use that information to answer the questions that follow. Note that the sample size is 150, the standard deviation is 0.010453, and p-bar is 0.0166667. Carry out all calculations to at least six decimal points. There are 12 data sets. you may need to scroll to the right to see them all. Hide Feedback These are small values so you have to carry out more decimal points. With less than four, you answers may be incorrect due to rounding. Question 22 1 / 1 point What is the lower control limit? Answer: 0 Hide Feedback Question 23 What is the center line? Answer: 0.0167 Hide Feedback 1 / 1 point Question 24 What is the upper control limit? Answer: 0.0480 Hide Feedback 1 / 1 point Question 25 1 / 1 point Point 1 is out-of-control. True False Hide Feedback Question 26 Point 2 is out-of-control. True False Hide Feedback 1 / 1 point Question 27 Point 3 is out-of-control. True False Hide Feedback 1 / 1 point Question 28 1 / 1 point Point 4 is out-of-control. True False Hide Feedback Question 29 Point 5 is out-of-control. True False Hide Feedback 1 / 1 point Question 30 Point 6 is out-of-control. True False Hide Feedback 1 / 1 point Question 31 1 / 1 point Point 7 is out-of-control. True False Hide Feedback Question 32 Point 8 is out-of-control. True False Hide Feedback 1 / 1 point Question 33 Point 9 is out-of-control. True False Hide Feedback 1 / 1 point Question 34 1 / 1 point Point 10 is out-of-control. True False Hide Feedback Question 35 Point 11 is out-of-control. True False Hide Feedback 1 / 1 point Question 36 Point 12 is out-of-control. True False Hide Feedback 1 / 1 point C Chart Using the data shown below, develop a three-sigma C-chart. Use that C-chart to work the problems that follow. Hide Feedback A common mistake is to work a C-chart as a p-chart. Question 37 1 / 1 point What is the lower control limit? Answer: 0.000 Hide Feedback Make sure you are working this as a C-chart. Question 38 What is the center line? 1 / 1 point Answer: 4.917 Hide Feedback Make sure you are working this as a C-chart. Question 39 What is the upper control limit? Answer: 11.569 Hide Feedback Make sure you are working this as a C-chart. 1 / 1 point Question 40 Period 1 is out-of-control. True False Hide Feedback 1 / 1 point Question 41 1 / 1 point Period 2 is out-of-control. True False Hide Feedback Question 42 Period 3 is out-of-control. True False Hide Feedback 1 / 1 point Question 43 Period 4 is out-of-control. True False Hide Feedback 1 / 1 point Question 44 1 / 1 point Period 5 is out-of-control. True False Hide Feedback Question 45 Period 6 is out-of-control. True False Hide Feedback 1 / 1 point Question 46 Period 7 is out-of-control. True False Hide Feedback 1 / 1 point Question 47 1 / 1 point Period 8 is out-of-control. True False Hide Feedback Question 48 Period 9 is out-of-control. True False Hide Feedback 1 / 1 point Question 49 Period 10 is out-of-control. True False Hide Feedback 1 / 1 point Question 50 1 / 1 point Period 11 is out-of-control. True False Hide Feedback Question 51 Period 12 is out-of-control. True False Hide Feedback 1 / 1 point Process Capability Use the following information to work the problems in this section. A process has a mean of 1.25 and a standard deviation of 0.03. The customer wants the process to have a mean between 1.15 and 1.40. Question 52 What is the process capability index (Cpk). Answer: 1.111 Hide Feedback 1 / 1 point Question 53 1 / 1 point What is the process capability index (Cp). Answer: 1.389 Hide Feedback A common mistake is to forget the last step and pick which of the numbers is the smallest. Reliability Question 54 0 / 1 point A product is composed of three parts. In order for the product to function properly in a given situation, each of the parts must function. The probabilities of functioning properly for the three parts are 0.94, 0.83, and 0.89 respectively. What is the overall probability that the product will function properly? Answer: 0.57 (0.69) Hide Feedback Use the series reliability formula. Question 55 1 / 1 point A component is absolutely critical to the proper functioning of a product. It has a reliability of 0.68. To improve its reliability, the firm has designed in two backup components with reliabilities of 0.57 and 0.57 respectively. All three must fail in order for the product to fail. What is the overall reliability of the component and its two backups? Answer: 0.926 Hide Feedback Use the formula for reliability with redundancy. Question 56 0 / 1 point A product has three components, A, B, and C. A failure of any of these three components would cause the product to fail. They have reliabilities of 0.83, 0.86, and 0.77 respectively. A failure of C might cause safety issues so it has a redundant backup D with a reliability of 0.85. What is the overall reliability of the product? Answer: 0.648 (0.689) Hide Feedback You must first find the combined reliability for C and D using the redundancy formula. Then, you give the series reliability for A, B, and the combined C/D. Question 57 1 / 1 point A copier has a mean time between failure of 2,730 hours and a mean time to repair of 41 hours. What is its availability? Answer: 0.989 Hide Feedback Use the availability formula, MTBF/(MTBF+MTR).
