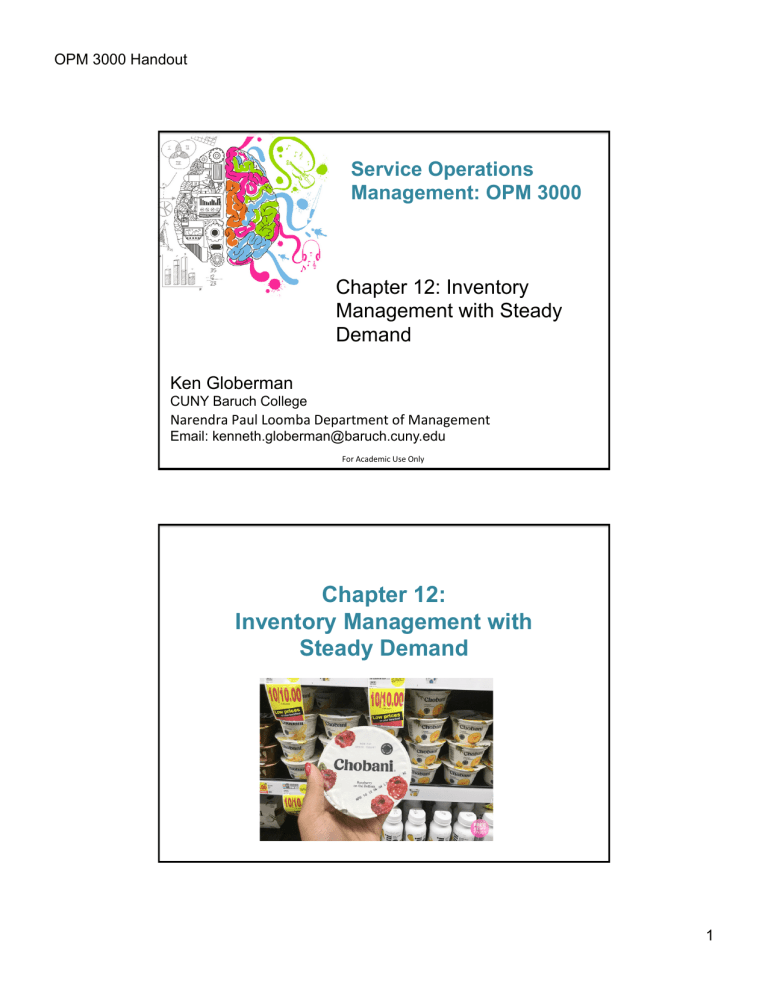
OPM 3000 Handout Service Operations Management: OPM 3000 Chapter 12: Inventory Management with Steady Demand Ken Globerman CUNY Baruch College Narendra Paul Loomba Department of Management Email: kenneth.globerman@baruch.cuny.edu For Academic Use Only Chapter 12: Inventory Management with Steady Demand 1 OPM 3000 Handout Learning Objectives o o o LO12-1. Evaluate optimal order quantities and performance measures with the EOQ model. LO12-2. Recognize the presence of economies of scale in inventory management and understand the impact of product variety on inventory costs. LO12-3. Evaluate optimal order quantities when there are quantity constraints or quantity discounts are offered. 12-2 Companies Need To Decide How Much Product To Order, At Any Given Time 2 OPM 3000 Handout The Economy Order Quantity Introducing the EOQ Model Economic order quantity (EOQ) model – a model used to select an order quantity that minimizes the sum of ordering and inventory holding costs per unit of time 12-3 The Economy Order Quantity This model is built on the following assumptions: o Demand occurs at a constant rate R o There is a fixed order cost K per order – This is independent of how much is ordered o There is a holding cost per unit of time h – This includes all costs associated with keeping a unit of inventory in stock for a period of time 12-4 3 OPM 3000 Handout The Economy Order Quantity This model is built on the following assumptions: o All demand is satisfied from inventory o Inventory never spoils, degrades, or is lost – Assumption that everything is eventually sold o Orders are delivered with a reliable lead time o There is a purchase price per unit that is independent of the quantity purchased – In other words, there is no quantity discount not always true in real life discounts for example happen 12-5 in real life The Economy Order Quantity The textbook illustrates the EOQ model by going through the exercise of Walmart purchasing of Tylenol 12-5 4 OPM 3000 Handout The Economy Order Quantity The goal of EOQ is to minimize the sum of all inventory costs in a period of time o Ordering cost per unit of time – is the sum of all fixed ordering costs in a period of time – If Walmart places 12 orders per year, then its ordering costs is $72 (12 orders per year x $6 per order) o Holding cost per unit of time – the total cost to hold inventory for a period of time – If Walmart holds 100 bottles on average in inventory throughout the year, its holding costs for the year is $75 12-6 The Economy Order Quantity o EOQ cost per unit of time – the sum of ordering and holding costs per unit of time o Purchasing cost – the cost to purchase inventory in a period of time – For Tylenol, $1872 per year ($3 per bottle [Walmart’s purchase price] x 624 bottles per year) 12-7 5 OPM 3000 Handout Inventory Patterns & Tradeoffs higher holding costs higher holding cost 12-10 Deriving The EOQ Cost Function We can now evaluate the average inventory for a given period of time: Once we know the average inventory, we can calculate the holding cost per unit time: Q is order quantity Now let’s look at ordering costs… 12-10 6 OPM 3000 Handout Deriving The EOQ Cost Function If Walmart sells R bottles per year and orders Q bottles with each order it must make R/Q orders per year (on average) R is demand rate Therefore, Walmart incurs the following ordering cost per unit time (eg: per year) ordering cost 12-10 Deriving The EOQ Cost Function Total inventory costs are the sum of ordering plus holding costs We have the following equation: 12-10 7 OPM 3000 Handout Graphing The EOQ Model As our order quantity size goes up, we order less times through the year and annual order costs go down But inversely, we have more inventory on hand, so our annual holding costs go up! 12-10 Graphing The EOQ Model EOQ Model Objective: Minimize Total Inventory Costs 12-10 8 OPM 3000 Handout The EOQ Model In Class Exercise Q = 12 and average inventory is 12-10 EOQ Optimal Order Quantity The Optimal Order Quantity Q* minimizes total inventory costs o We can use calculus to minimize the function, or simply refer to this formula solving for Q*, the “Economic Order Quantity”: Q* = o 2× K × R h where K = the ordering cost, R = the demand and h = the holding cost 9 OPM 3000 Handout EOQ Optimal Order Quantity In Class Exercise EOQ Cost Once we calculate Q*, we can use this quantity to determine the minimum EOQ inventory cost In the previous Tylenol example, with Q* = 100 bottles, EOQ cost is: As a % of cost per unit of time, the Tylenol ordering + holding cost is $74.94/$1,872 = 4% of the purchasing cost. Is this a lot? For a low margin business, it sure is! 10 OPM 3000 Handout EOQ Cost In Class Exercise Intermission 11 OPM 3000 Handout Economies of Scale When a process has certain fixed costs (such as setup costs), we can get more “bang for the buck” by producing in larger lots Economies of scale – describes a relationship between operational efficiency and demand in which greater demand leads to a more efficient process o Our EOQ Tylenol model had fixed ordering costs – Ordering costs were the same for 1 or 1,000 bottles 12-11 – But demand surely plays a role in our decision making Economies of Scale Application of the EOQ model on Tylenol with different demand rates Our original scenario Insight 1: As order size increases, overall EOQ cost go up but EOQ 12-11 cost as a % of purchase cost goes down Insight 2: As demand doubles, annual EOQ cost C(Q*) increases at a much slower rate (41%) 12 OPM 3000 Handout The Impact Of Product Variety How much product variety should your business offer? o Offer too little – and you may not satisfy the variety of customers’ tastes o But offer too much – and your demand for each variety is effected, potentially reducing efficiency and economies of scale Product substitution – this occurs when people may be willing to purchase a less-preferred version if their most preferred version is not available 12-11 Back To The EOQ Model Adding A Bit More Complexity The Tylenol example was a bit simplistic in nature o Rarely can we order exactly the optimal lot size (recall Q* was 100 bottles per order) – Shipping companies often impose practical restrictions or limitations on order size o And in the real world, we’re often incentivized by price discounts for ordering in larger batches – Recall the EOQ model ignored product purchasing costs12-11 13 OPM 3000 Handout Volume Discounting More Definitions o Pallet – either a platform which is used to stack inventory or the quantity of inventory that is stacked on the platform o Tier – the quantity of product in one layer of a pallet o Distribution center (DC) – a facility designed to receive product from suppliers, store inventory, and ship products to retail stores (we’ve seen this one) 12-14 Quantity Constraints o o o What would happen if Walmart could only order Tylenol by the whole case (72 bottles in a case) If the ideal order quantity is 100 bottles, what would we do? We would analyze the closest possible ordering sizes: 72 bottles or 144 bottles 12-17 14 OPM 3000 Handout Quantity Constraints In Class Exercise 12-17 Quantity Discounts o A quantity discount can be used as a motivator to order larger quantities Volume discount o Larger quantities increases the sum of ordering and holding costs (above the minimum)… …BUT may make the overall cost (including purchasing costs) more economical! 12-17 15 OPM 3000 Handout Quantity Discounts o Let’s go back to our Tylenol example and make the following assumptions: 12-17 EOQ Steps With Quantity Discounts o Step 1: Evaluate the EOQ given the regular price (account for any order size restrictions) and call this Q* Q* = o 2× K × R h Note we have a tier restriction, which is 1,440 bottles. So technically we must order in multiples of 1,440. 1,317 if very close to one tier, so we’ll go with 1,440 as our order quantity. 12-18 16 OPM 3000 Handout EOQ Steps With Quantity Discounts o o o o Step 2: If the EOQ is above the threshold for the volume discounted price, Qd, re-calculate EOQ given the discounted price Call this quantity Q** and order at this level In our example, this discount only applies when we order at least one pallet Since we are ordering less (one tier of a pallet), step 2 does not apply EOQ Steps With Quantity Discounts o Step 3: If the EOQ is below the threshold for the volume discounted price, Qd, then: o Step 3a: the sum of ordering + holding costs using EOQ quantity and regular pricing is: o Add the purchasing costs of $195,000 (65,000 x $3/bottle) and the total is $195,793. Call this C*. 17 OPM 3000 Handout EOQ Steps With Quantity Discounts o Step 3: If the EOQ is below the threshold for the volume discounted price, Qd, then: o Step 3b: The sum of ordering + holding costs using the min quantity to get the discount and the discounted pricing is: o Add the purchasing costs of $187,200 (65,000 x $2.88/ bottle) and the total is $190,155 and call this Cd EOQ Steps With Quantity Discounts o Step 3: If the EOQ is below the threshold for the volume discounted price, Qd, then: o Step 3c: We compare the two results: $190,155 < $195,783 and go with the minimum order quantity to receive the volume discount o Why? The ordering + inventory costs may be higher, but the savings from the volume discount outweigh it! 18 OPM 3000 Handout Summary EOQ Analysis With Quantity Discounts Graphical Illustration of the EOQ Model With Quantity Discounts o The following graphic illustrates cost curves for a two tier discounting situation. Note the two feasible order quantities. Note: these cost values do not correspond to the previous exercise 19 OPM 3000 Handout Quantity Discounts In Class Exercise 12-17 The Effect Of Purchase Discounts Takeaways o Bottom line: Volume discounts reduce overall purchasing costs o Larger purchase quantities may be optimal even if the discount appears to be small o Firms are more price sensitive than consumers (even a 1% price discount can make a big difference!) 12-18 20 OPM 3000 Handout Homework 1. Do the ‘Chapter 12 Assessment’ (Quiz) on Connect (required) by Sunday 2. Do the Chapter 12 Problem Set to get more practice 3. Read and complete the next chapter, ‘Chapter 15 Smart Book’, on Connect (required) by Tuesday 4. Check exact deadline times on Connect! Service Operations Management: OPM 3000 See You Next Week! Ken Globerman CUNY Baruch College Narendra Paul Loomba Department of Management Email: kenneth.globerman@baruch.cuny.edu For Academic Use Only 21
