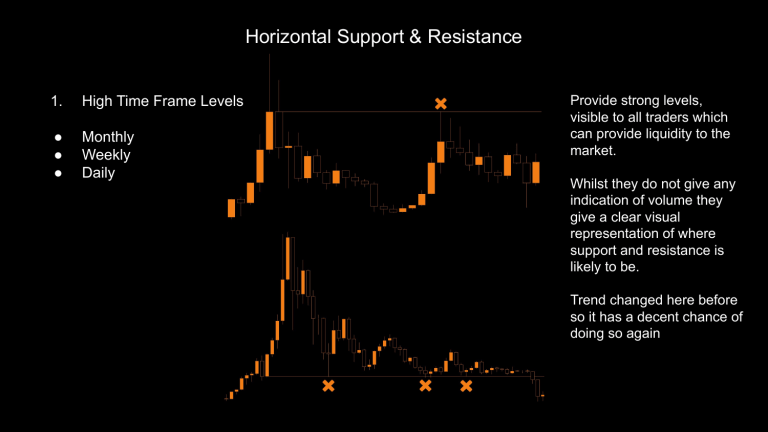
Horizontal Support & Resistance 1. High Time Frame Levels ● ● ● Monthly Weekly Daily Provide strong levels, visible to all traders which can provide liquidity to the market. Whilst they do not give any indication of volume they give a clear visual representation of where support and resistance is likely to be. Trend changed here before so it has a decent chance of doing so again General Rules. ● ● ● ● ● ● ● Use top down analysis to identify your levels. Look for candles which show a change of trend (pivot). Favour higher time frame - a daily and monthly are close, use the monthly. Favour newer levels - daily levels close in price but weeks apart, use the newer one. Be aware of old levels - You never know if price may come back to them! Levels are strongest on the first test. Favour ones that have not been touched. Also mark your daily, weekly, monthly open. They can act like a magnet and help to identify the trend. Horizontal Support & Resistance 2. Order Blocks Can be used in a similar way to HTF levels but give added accuracy and variations to trade. There are many different strategies to trading OBs and different ways of plotting them. Indecision before reversal / continuation. ● Start with higher time frames. Weekly, Daily, 4H ● Similar to HTF levels, start by looking for a candle at pivot high / low ● Last down candle before move up or last up candle before move down ● Candle should be engulfed and not quickly backtested. Wicks into an OB are no good ● You can add order blocks in the middle of a range if there is a period of indecision before an impulse in the direction of the trend. ● Use fibonacci levels, volume profile or lower time frames (blocks within blocks) for confluence ● Can be done on any time frame but be mindful of the bigger picture. Trade with the trend ● Higher time frame blocks give less chop and better entries. Much more reliable. ● Use standard entry triggers, change of MS, enter on retest. 0.5 Fibonacci Example Continuation Block Impulsive candles with compact OB formed during sideways period Change of Market Structure, do not expect a return to the highs Low Time Frame example Backtest, range formed but gets continuation due to break of LTF MS and being drawn into old range Candle at pivot low leading to break in market structure Rotation back up with both blocks acting as support / resistance.


