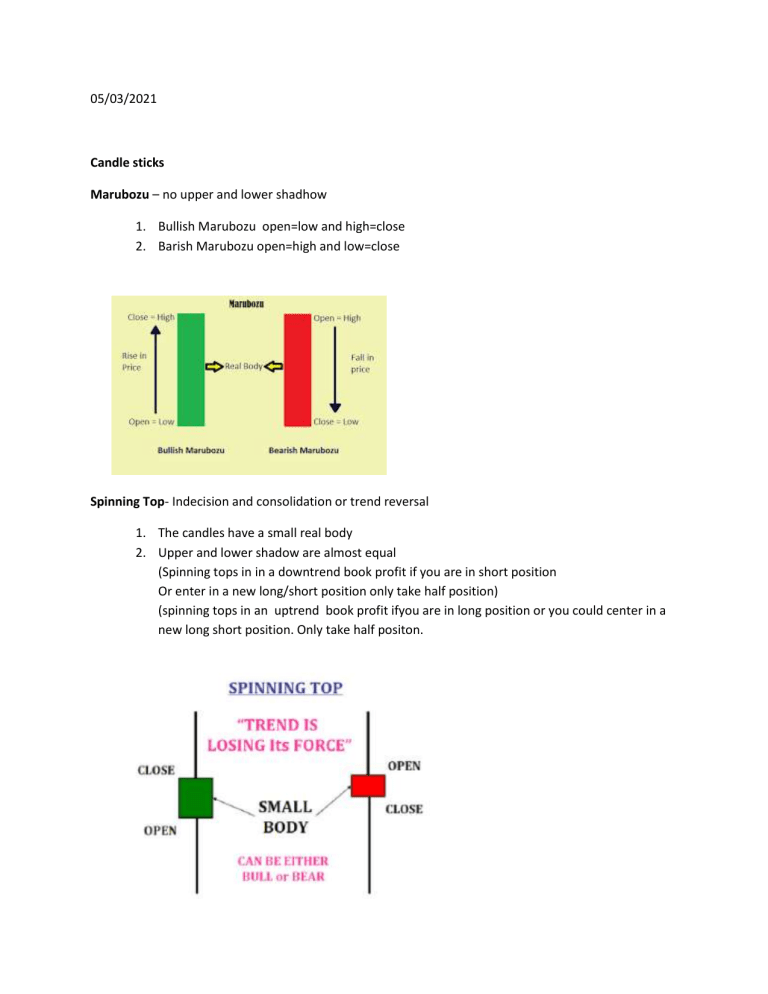
05/03/2021 Candle sticks Marubozu – no upper and lower shadhow 1. Bullish Marubozu open=low and high=close 2. Barish Marubozu open=high and low=close Spinning Top- Indecision and consolidation or trend reversal 1. The candles have a small real body 2. Upper and lower shadow are almost equal (Spinning tops in in a downtrend book profit if you are in short position Or enter in a new long/short position only take half position) (spinning tops in an uptrend book profit ifyou are in long position or you could center in a new long short position. Only take half positon. Doji – The Doji is very similar to the spinning tops except that it does not have a real Body at all. This means the open and close prices are equal. 1. A Doji indicates indecision in the market. Indicator for trend reversal as well Paper Umbrella:- The paper umbrella is a single candle stick pattern which helps traders in setting up directional trade. Small upper body Long lower shadow. To qualify a candle as a paper umbrella the length of the lower shadow should be at least twice the length of the real body. 1. Hammer – paper umbrella appears at the bottom end of the downward rally Indicates trend reversal to bullish. Buy at close. SL at low. 2. Hanging Man : paper umbrella appears at the top end of a downward rally. Indicates trend reversal to bearish. Shell at close SL at High. Shooting Star. The shooting star is a single candle stick pattern which helps traders in stetting up directional Trades. The shooting star is bearish Patten hence the prior trend should be bullish. 1. Small lower body 2. Long upper shadow. The longer the upper wick the more bearish is the pattern. 3. Sell at close SL at High _______________________________ Multiple Candle Pattern Engulfing Pattern Bullish Engulfing pattern The prior trend should be a downtrend First day of the pattern (C1) should be a red candle reconfirming the bearishness in the market The candle on the 2nd day of pattern (C2) should be Green candle long enough to engulf the red Candle. Buy at Close of C2. SL at low of C1/C2. Bearish Engulfing Pattern. The prior trend should be a uptrend The first day of the pattern (C1) should be green candle reconfirming the bullishness in the Market The candle on the2nd day of pattern (C2) should be a red candle long enough to engulf the Green candle. Sell at close of C2. SL at High of C1/C2. Partial Engulfing Pattern. Partial Engulfing is a two candle pattern this happen second candle partial engulf first candle Indicate trend reversal. Very similar to Engulfing The Piercing Pattern (Engulfing) The prior trend should be a downtrend The first day of the pattern (C1) should be a red Candle reconfirming the bearishness I the Market The candle on the 2nd day of pattern (C2) should be green candle long enough to engulf 50% to 100% of the red candle. Buy at Close of C2. SL at Low of C1/C2 The dark cloud cover The prior trend should be a uptrend The first day of the pattern (C1) should be a green candle reconfirming the bullishness in the Market The candle on the 2nd day of pattern (C2) should be a red candle long enough to engulf 50% to 100% of the green candle Sell at close to C2 SL at High of C1/C2 Harami Pattern Haramais two candle pattern. The first candle is usually long and the second candle has small Body. Indicates trend reversal harami is old Japanese for pregnant. Bullish Harami Pattern.:The prior trend should be a downtrend The first day of the pattern(C1) should be a red candle Reconfirming the bearishness in the market The candle on the 2nd day of pattern (C2) should open higher than C1 close and close lower than C1 open, thereby bears are in panic Buy at close of C2. SL at Low of C1/C2 Bearish Harami Pattern:The prior trend should be a uptrend The first day of the pattern (C1) should be a green candle Reconfirming the bullishness in the market The candle on the 2nd day of pattern (C2) should open lower than C1 close and close higher than C1 open, thereby bulls are in panic Sell at close of C2. SL at High of C1/C2 Than C1 open, thereby bears are in panic Buy at close of C2. SL at low of C1/C2 Bearish Harami pattern(Engulfing) The prior trend should be a uptrend The First day of the pattern C1 should be a green candle reconfirming thebullishness I the Market. The candle on the 2nd day of pattern (C2) should open lower than C1 Close and close higher than C1 open thereby hulls are in panic Sell at close of C2. SL at High of C1/C2 Gap up opening and Gap down opening Morning star pattern and evening star pattern Evening Star Pattern Moving average SMA and ESM 200 bas 200/50 cross over SMA 13/48 cross over SMA(better to use) _____________________________ MACD Stochastics Indicator :- Leading indicator RSI Indicator I Step II Step III Step Contents in Brokers Order Form
