Python For Data Science Cheat Sheet
Pandas Basics
Learn Python for Data Science Interactively at www.DataCamp.com
Asking For Help
Selection
Also see NumPy Arrays
Getting
>>> s['b']
Get one element
>>> df[1:]
Get subset of a DataFrame
-5
Pandas
The Pandas library is built on NumPy and provides easy-to-use
data structures and data analysis tools for the Python
programming language.
Dropping
>>> help(pd.Series.loc)
1
2
Country
India
Brazil
Capital
New Delhi
Brasília
Population
1303171035
207847528
By Position
>>> import pandas as pd
>>> df.iloc[[0],[0]]
'Belgium'
Pandas Data Structures
Index
a
3
b
-5
c
7
d
4
>>> s = pd.Series([3, -5, 7, 4], index=['a', 'b', 'c', 'd'])
DataFrame
Columns
Index
Select single value by row &
column
'Belgium'
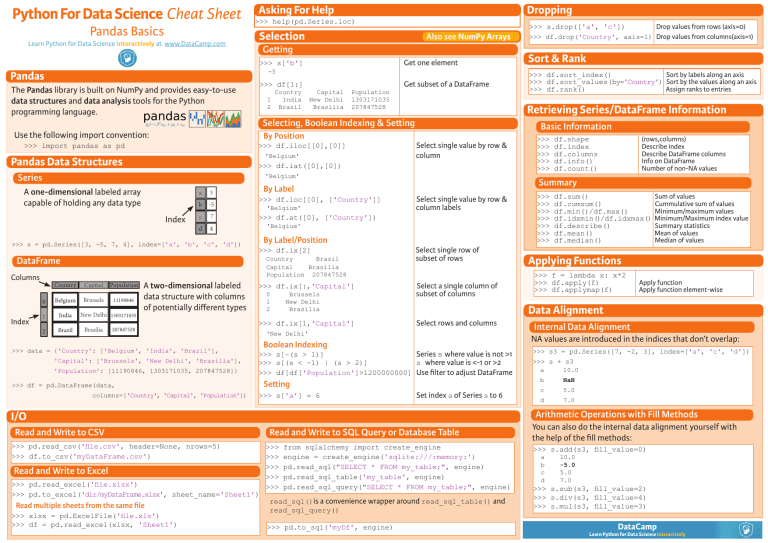
A one-dimensional labeled array
capable of holding any data type
Country
0
Belgium
1
India
2
Brazil
Capital
Brussels
Population
11190846
New Delhi 1303171035
Brasília
A two-dimensional labeled
data structure with columns
of potentially different types
207847528
>>> data = {'Country': ['Belgium', 'India', 'Brazil'],
'Capital': ['Brussels', 'New Delhi', 'Brasília'],
'Population': [11190846, 1303171035, 207847528]}
>>> df = pd.DataFrame(data,
columns=['Country', 'Capital', 'Population'])
'Belgium'
Select single value by row &
column labels
>>> df.at([0], ['Country'])
'Belgium'
By Label/Position
>>> df.ix[2]
Select single row of
subset of rows
>>> df.ix[:,'Capital']
Select a single column of
subset of columns
>>> df.ix[1,'Capital']
Select rows and columns
Country
Brazil
Capital
Brasília
Population 207847528
0
1
2
Brussels
New Delhi
Brasília
Boolean Indexing
Setting
Set index a of Series s to 6
Read and Write to Excel
>>> pd.read_excel('file.xlsx')
>>> pd.to_excel('dir/myDataFrame.xlsx', sheet_name='Sheet1')
Read multiple sheets from the same file
>>> xlsx = pd.ExcelFile('file.xls')
>>> df = pd.read_excel(xlsx, 'Sheet1')
(rows,columns)
Describe index
Describe DataFrame columns
Info on DataFrame
Number of non-NA values
>>>
>>>
>>>
>>>
>>>
>>>
>>>
df.sum()
df.cumsum()
df.min()/df.max()
df.idxmin()/df.idxmax()
df.describe()
df.mean()
df.median()
Sum of values
Cummulative sum of values
Minimum/maximum values
Minimum/Maximum index value
Summary statistics
Mean of values
Median of values
Applying Functions
>>> f = lambda x: x*2
>>> df.apply(f)
>>> df.applymap(f)
Apply function
Apply function element-wise
Internal Data Alignment
>>> s3 = pd.Series([7, -2, 3], index=['a', 'c', 'd'])
>>> s + s3
a
10.0
c
5.0
b
d
NaN
7.0
Arithmetic Operations with Fill Methods
I/O
>>> pd.read_csv('file.csv', header=None, nrows=5)
>>> df.to_csv('myDataFrame.csv')
df.shape
df.index
df.columns
df.info()
df.count()
NA values are introduced in the indices that don’t overlap:
>>> s[~(s > 1)]
Series s where value is not >1
>>> s[(s < -1) | (s > 2)]
s where value is <-1 or >2
>>> df[df['Population']>1200000000] Use filter to adjust DataFrame
Read and Write to CSV
>>>
>>>
>>>
>>>
>>>
Data Alignment
'New Delhi'
>>> s['a'] = 6
>>> df.sort_index()
Sort by labels along an axis
>>> df.sort_values(by='Country') Sort by the values along an axis
>>> df.rank()
Assign ranks to entries
Summary
By Label
>>> df.loc[[0], ['Country']]
Sort & Rank
Basic Information
>>> df.iat([0],[0])
Series
Drop values from rows (axis=0)
>>> df.drop('Country', axis=1) Drop values from columns(axis=1)
Retrieving Series/DataFrame Information
Selecting, Boolean Indexing & Setting
Use the following import convention:
>>> s.drop(['a', 'c'])
Read and Write to SQL Query or Database Table
>>>
>>>
>>>
>>>
>>>
from sqlalchemy import create_engine
engine = create_engine('sqlite:///:memory:')
pd.read_sql("SELECT * FROM my_table;", engine)
pd.read_sql_table('my_table', engine)
pd.read_sql_query("SELECT * FROM my_table;", engine)
read_sql()is a convenience wrapper around read_sql_table() and
read_sql_query()
>>> pd.to_sql('myDf', engine)
You can also do the internal data alignment yourself with
the help of the fill methods:
>>> s.add(s3, fill_value=0)
a
b
c
d
10.0
-5.0
5.0
7.0
>>> s.sub(s3, fill_value=2)
>>> s.div(s3, fill_value=4)
>>> s.mul(s3, fill_value=3)
DataCamp
Learn Python for Data Science Interactively

