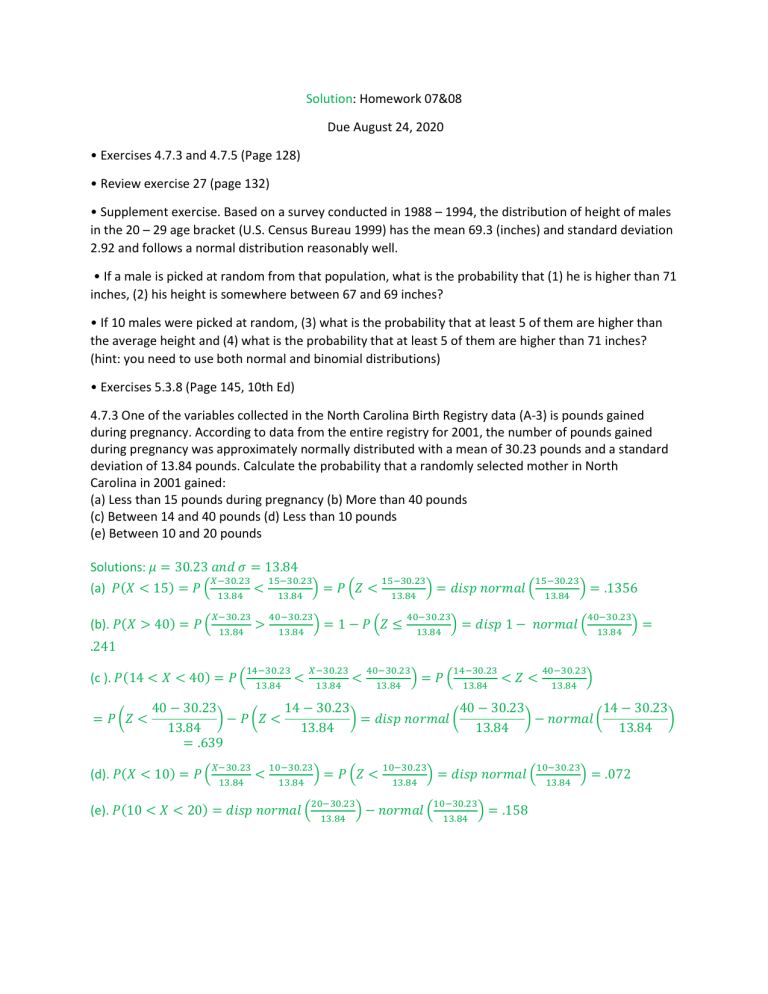
Solution: Homework 07&08 Due August 24, 2020 • Exercises 4.7.3 and 4.7.5 (Page 128) • Review exercise 27 (page 132) • Supplement exercise. Based on a survey conducted in 1988 – 1994, the distribution of height of males in the 20 – 29 age bracket (U.S. Census Bureau 1999) has the mean 69.3 (inches) and standard deviation 2.92 and follows a normal distribution reasonably well. • If a male is picked at random from that population, what is the probability that (1) he is higher than 71 inches, (2) his height is somewhere between 67 and 69 inches? • If 10 males were picked at random, (3) what is the probability that at least 5 of them are higher than the average height and (4) what is the probability that at least 5 of them are higher than 71 inches? (hint: you need to use both normal and binomial distributions) • Exercises 5.3.8 (Page 145, 10th Ed) 4.7.3 One of the variables collected in the North Carolina Birth Registry data (A-3) is pounds gained during pregnancy. According to data from the entire registry for 2001, the number of pounds gained during pregnancy was approximately normally distributed with a mean of 30.23 pounds and a standard deviation of 13.84 pounds. Calculate the probability that a randomly selected mother in North Carolina in 2001 gained: (a) Less than 15 pounds during pregnancy (b) More than 40 pounds (c) Between 14 and 40 pounds (d) Less than 10 pounds (e) Between 10 and 20 pounds Solutions: 𝜇 = 30.23 𝑎𝑛𝑑 𝜎 = 13.84 𝑋−30.23 13.84 < 15−30.23 ) 13.84 = 𝑃 (𝑍 < 𝑋−30.23 13.84 > 40−30.23 ) 13.84 = 1 − 𝑃 (𝑍 ≤ (a) 𝑃(𝑋 < 15) = 𝑃 ( (b). 𝑃(𝑋 > 40) = 𝑃 ( 15−30.23 ) 13.84 15−30.23 ) 13.84 = 𝑑𝑖𝑠𝑝 𝑛𝑜𝑟𝑚𝑎𝑙 ( 40−30.23 ) 13.84 = .1356 40−30.23 ) 13.84 = 𝑑𝑖𝑠𝑝 1 − 𝑛𝑜𝑟𝑚𝑎𝑙 ( = .241 (c ). 𝑃(14 < 𝑋 < 40) = 𝑃 ( = 𝑃 (𝑍 < 14−30.23 13.84 < 𝑋−30.23 13.84 < 40−30.23 ) 13.84 14−30.23 13.84 = 𝑃( <𝑍< 40−30.23 ) 13.84 40 − 30.23 14 − 30.23 40 − 30.23 14 − 30.23 ) − 𝑃 (𝑍 < ) = 𝑑𝑖𝑠𝑝 𝑛𝑜𝑟𝑚𝑎𝑙 ( ) − 𝑛𝑜𝑟𝑚𝑎𝑙 ( ) 13.84 13.84 13.84 13.84 = .639 𝑋−30.23 13.84 (d). 𝑃(𝑋 < 10) = 𝑃 ( < 10−30.23 ) 13.84 = 𝑃 (𝑍 < 20−30.23 )− 13.84 (e). 𝑃(10 < 𝑋 < 20) = 𝑑𝑖𝑠𝑝 𝑛𝑜𝑟𝑚𝑎𝑙 ( 10−30.23 ) 13.84 10−30.23 ) 13.84 𝑛𝑜𝑟𝑚𝑎𝑙 ( 10−30.23 ) 13.84 = 𝑑𝑖𝑠𝑝 𝑛𝑜𝑟𝑚𝑎𝑙 ( = .158 = .072 4.7.5 If the total cholesterol values for a certain population are approximately normally distributed with a mean of 200 mg/100 ml and a standard deviation of 20 mg/100 ml, find the probability that an individual picked at random from this population will have a cholesterol value: (a) Between 180 and 200 mg/100 ml (b) Greater than 225 mg/100 ml (c) Less than 150 mg/100 ml (d) Between 190 and 210 mg/100 ml Solutions: 𝜇 = 200𝑚𝑔/100𝑚𝑙 𝑎𝑛𝑑 𝜎 = 20𝑚𝑔/100𝑚𝑙 200−200 180−200 ) − 𝑛𝑜𝑟𝑚𝑎𝑙 ( 20 ) 20 (a) 𝑃(180 < 𝑋 < 200) = 𝑑𝑖𝑠𝑝 𝑛𝑜𝑟𝑚𝑎𝑙 ( 225−200 ) 20 (b). 𝑃(𝑋 > 225) = 𝑑𝑖𝑠𝑝 1 − 𝑛𝑜𝑟𝑚𝑎𝑙 ( 150−200 ) 20 (c ). 𝑃(𝑋 < 150) = 𝑑𝑖𝑠𝑝 𝑛𝑜𝑟𝑚𝑎𝑙 ( = .341 = .106 = .0062 210−200 )− 20 (d ). 𝑃(190 < 𝑋 < 210) = 𝑑𝑖𝑠𝑝 𝑛𝑜𝑟𝑚𝑎𝑙 ( 190−200 ) 20 𝑛𝑜𝑟𝑚𝑎𝑙 ( = .383 27. Given the normally distributed random variable X with mean 100 and standard deviation 15, find the numerical value of k such that: Solutions: 𝜇 = 100 𝑎𝑛𝑑 𝜎 = 15 𝑘−100 𝑘−100 ) , 𝑡ℎ𝑒𝑛 15 15 (a). 𝑃(𝑋 ≤ 𝑘) = .0094 = 𝑑𝑖𝑠𝑝 𝑛𝑜𝑟𝑚𝑎𝑙 ( = 𝑑𝑖𝑠𝑝 𝑖𝑛𝑣𝑛𝑜𝑟𝑚𝑎𝑙(. 0094) = −2.35 ∴. 𝑘 = −2.35 × 15 + 100 = 64.75 (b). 𝑃(𝑋 ≥ 𝑘) = .1093 = 1 − 𝑃(𝑋 < 𝑘) → 𝑃(𝑋 < 𝑘) = 1 − .1093 = .8907 = 𝑑𝑖𝑠𝑝 𝑛𝑜𝑟𝑚𝑎𝑙 ( 𝑘 − 100 𝑘 − 100 ) , 𝑡ℎ𝑒𝑛 = 𝑑𝑖𝑠𝑝 𝑖𝑛𝑣𝑛𝑜𝑟𝑚𝑎𝑙(. 8907) = 1.23 15 15 ∴. 𝑘 = 1.23 × 15 + 100 = 118.45 𝑘−100 100−100 ) − 𝑛𝑜𝑟𝑚𝑎𝑙 ( 15 ) 15 100−100 𝑛𝑜𝑟𝑚𝑎𝑙 ( ) = .9778, 15 (c ). 𝑃(100 ≤ 𝑋 ≤ 𝑘) = .4778 = 𝑑𝑖𝑠𝑝 𝑛𝑜𝑟𝑚𝑎𝑙 ( 𝑑𝑖𝑠𝑝 𝑘−100 𝑛𝑜𝑟𝑚𝑎𝑙 ( ) 15 = 𝑑𝑖𝑠𝑝 .4778 + 𝑡ℎ𝑒𝑛 → 𝑘 − 100 = 𝑑𝑖𝑠𝑝 𝑖𝑛𝑣𝑛𝑜𝑟𝑚𝑎𝑙(. 9778) = 2.01 15 ∴. 𝑘 = 2.01 × 15 + 100 = 130.15 𝑘−100 )− 15 (d). (c ). 𝑃(𝑘 ′ ≤ 𝑋 ≤ 𝑘) = .9660 = 𝑑𝑖𝑠𝑝 𝑛𝑜𝑟𝑚𝑎𝑙 ( 𝑘 ′ −100 ) 15 𝑛𝑜𝑟𝑚𝑎𝑙 ( But k and k’ are equidistant from center. Then Φ(𝑧 ′ ) = 1 − Φ(𝑧), 𝑤ℎ𝑒𝑟𝑒 𝑧 = 𝑘−100 . 15 So, . 9660 = 𝑃(𝑋 ≤ 𝑘) − 𝑃(𝑋 ≤ 𝑘 ′ ) = 𝑃(𝑋 ≤ 𝑘) − (1 − 𝑃(𝑋 ≤ 𝑘)) = 2𝑃(𝑋 ≤ 𝑘) − 1 → 2𝑃(𝑋 ≤ 𝑘) 1.9660 = 1 + .9660 = 1.9660 → 𝑃(𝑋 ≤ 𝑘) = = .983 2 𝑘−100 ) 15 → 𝑑𝑖𝑠𝑝 𝑛𝑜𝑟𝑚𝑎𝑙 ( 𝑘−100 15 = .983, 𝑡ℎ𝑒𝑛 = 𝑑𝑖𝑠𝑝 𝑖𝑛𝑣𝑛𝑜𝑟𝑚𝑎𝑙(. 983) = 2.12 ∴. 𝑘 = 2.12 × 15 + 100 = 131.8 Supplement exercise. Based on a survey conducted in 1988 – 1994, the distribution of height of males in the 20 – 29 age bracket (U.S. Census Bureau 1999) has the mean 69.3 (inches) and standard deviation 2.92 and follows a normal distribution reasonably well. • If a male is picked at random from that population, what is the probability that (1) he is higher than 71 inches, (2) his height is somewhere between 67 and 69 inches? • If 10 males were picked at random, (3) what is the probability that at least 5 of them are higher than the average height and (4) what is the probability that at least 5 of them are higher than 71 inches? (hint: you need to use both normal and binomial distributions) Solutions: 𝜇 = 69.3 𝑎𝑛𝑑 𝜎 = 2.92 71−69.3 ) 2.92 (1) 𝑃(𝑋 > 71) = 𝑑𝑖𝑠𝑝 1 − 𝑛𝑜𝑟𝑚𝑎𝑙 ( = .280 69−69.3 )− 2.92 (2). 𝑃(67 < 𝑋 < 69) = 𝑑𝑖𝑠𝑝 𝑛𝑜𝑟𝑚𝑎𝑙 ( 67−69.3 ) 2.92 𝑛𝑜𝑟𝑚𝑎𝑙 ( = .244 (c ). 𝑆𝑎𝑚𝑝𝑙𝑒 𝑠𝑖𝑧𝑒 (𝑛) = 10, 𝑋 > 𝑎𝑣𝑒𝑟𝑎𝑔𝑒 𝑎𝑛𝑑 𝑀 ≥ 5. .𝐹𝑖𝑟𝑠𝑡, 𝑢𝑠𝑒 𝑛𝑜𝑟𝑚𝑎𝑙 𝑡𝑜 𝑓𝑖𝑛𝑑 𝑡ℎ𝑒 𝑝𝑟𝑜𝑏𝑎𝑏𝑖𝑙𝑖𝑡𝑦 𝑜𝑓 𝑠𝑢𝑐𝑐𝑒𝑠𝑠. 𝑆𝑜, 𝑃(𝑋 > 𝑎𝑣𝑒𝑟𝑎𝑔𝑒) = 𝑃(𝑋 > 69.3) = 𝑑𝑖𝑠𝑝 1 − 𝑛𝑜𝑟𝑚𝑎𝑙(0) = .5 .𝑇ℎ𝑒𝑛 𝑢𝑠𝑒 𝑏𝑖𝑛𝑜𝑚𝑖𝑎𝑙 𝑑𝑖𝑠𝑡. 𝑡𝑜 𝑓𝑖𝑛𝑑 𝑡ℎ𝑒 𝑝𝑟𝑜𝑏. 𝑡ℎ𝑎𝑡 𝑀 ≥ 5. 𝑆𝑜, 𝑃(𝑀 ≥ 5) = 1 − 𝑃(𝑀 < 5) = 1 − 𝑃(𝑀 ≤ 4) = 𝑑𝑖𝑠𝑝 1 − 𝑏𝑖𝑛𝑜𝑚𝑖𝑎𝑙(10,4, .5) = .623 (d). 𝑆𝑎𝑚𝑝𝑙𝑒 𝑠𝑖𝑧𝑒 (𝑛) = 10, 𝑋 > 71 𝑎𝑛𝑑 𝑀 ≥ 5. .𝐹𝑖𝑟𝑠𝑡, 𝑢𝑠𝑒 𝑛𝑜𝑟𝑚𝑎𝑙 𝑡𝑜 𝑓𝑖𝑛𝑑 𝑡ℎ𝑒 𝑝𝑟𝑜𝑏𝑎𝑏𝑖𝑙𝑖𝑡𝑦 𝑜𝑓 𝑠𝑢𝑐𝑐𝑒𝑠𝑠. 𝑆𝑜, 𝑃(𝑋 > 71) = 𝑑𝑖𝑠𝑝 1 − 𝑛𝑜𝑟𝑚𝑎𝑙 ( 71 − 69.3 ) = .280 2.92 .𝑇ℎ𝑒𝑛 𝑢𝑠𝑒 𝑏𝑖𝑛𝑜𝑚𝑖𝑎𝑙 𝑑𝑖𝑠𝑡. 𝑡𝑜 𝑓𝑖𝑛𝑑 𝑡ℎ𝑒 𝑝𝑟𝑜𝑏. 𝑡ℎ𝑎𝑡 𝑀 ≥ 5. 𝑆𝑜, 𝑃(𝑀 ≥ 5) = 1 − 𝑃(𝑀 < 5) = 1 − 𝑃(𝑀 ≤ 4) = 𝑑𝑖𝑠𝑝 1 − 𝑏𝑖𝑛𝑜𝑚𝑖𝑎𝑙(10,4, .280) = .118 5.3.8 Suppose a population consists of the following values: 1, 3, 5, 7, 9. Construct the sampling distribution of 𝑋̅ based on samples of size 2 selected without replacement. Find the mean and variance of the sampling distribution. Solution: Sampling condition is without replacement and one at a time. Using table, we displayed all possible samples of size 2 and values of 𝑋̅. 1 1st pick (say, 𝑋1 ) 1 3 5 7 9 3 1,3 → 𝑥̅ = 2 2nd pick (say,𝑋2 ) 5 7 1,5 → 𝑥̅ = 3 1,7 → 𝑥̅ = 4 3,5 → 𝑥̅ = 4 3,7 → 𝑥̅ = 5 5,7 → 𝑥̅ = 6 9 1,9 → 𝑥̅ 3,9 → 𝑥̅ 5,9 → 𝑥̅ 7,9 → 𝑥̅ Number of possible outcomes is 5𝐶2 = 10, then 𝑀𝑒𝑎𝑛 = 𝐸(𝑋̅) = ∑𝑥̅ 𝑃(𝑥̅ ) = (2 + 3 + 7 + 8) × 1 2 + (4 + 5 + 6) × =5 10 10 2 2 𝑉𝑎𝑟𝑖𝑎𝑛𝑐𝑒 = 𝐸(𝑋̅ − 𝐸(𝑋̅)) = ∑(𝑥̅ − 𝐸(𝑋̅)) 𝑃(𝑥̅ ) = ((2 − 5)2 + (3 − 5)2 + (7 − 5)2 + (8 − 5)2 ) × + ((4 − 5)2 + (5 − 5)2 + (6 − 5)2 ) × 2 =3 10 1 10 =5 =6 =7 =8
