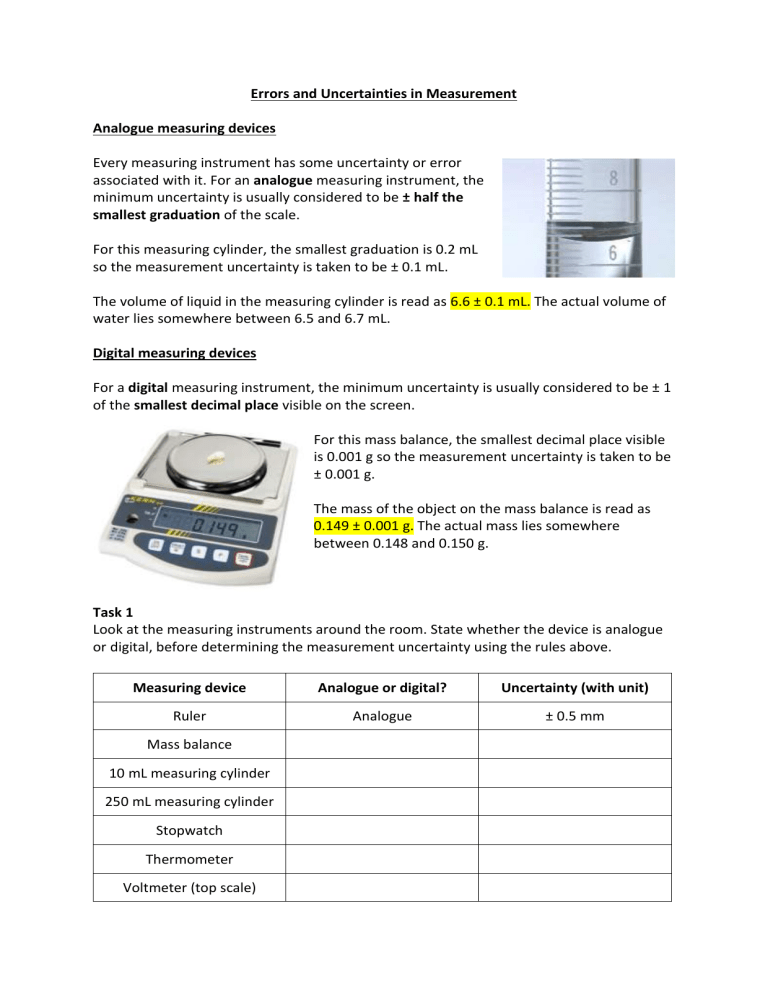
Errors and Uncertainties in Measurement Analogue measuring devices Every measuring instrument has some uncertainty or error associated with it. For an analogue measuring instrument, the minimum uncertainty is usually considered to be ± half the smallest graduation of the scale. For this measuring cylinder, the smallest graduation is 0.2 mL so the measurement uncertainty is taken to be ± 0.1 mL. The volume of liquid in the measuring cylinder is read as 6.6 ± 0.1 mL. The actual volume of water lies somewhere between 6.5 and 6.7 mL. Digital measuring devices For a digital measuring instrument, the minimum uncertainty is usually considered to be ± 1 of the smallest decimal place visible on the screen. For this mass balance, the smallest decimal place visible is 0.001 g so the measurement uncertainty is taken to be ± 0.001 g. The mass of the object on the mass balance is read as 0.149 ± 0.001 g. The actual mass lies somewhere between 0.148 and 0.150 g. Task 1 Look at the measuring instruments around the room. State whether the device is analogue or digital, before determining the measurement uncertainty using the rules above. Measuring device Analogue or digital? Uncertainty (with unit) Ruler Analogue ± 0.5 mm Mass balance 10 mL measuring cylinder 250 mL measuring cylinder Stopwatch Thermometer Voltmeter (top scale) Task 2 – Taking measurements Use the measuring instruments around the room to measure the following quantities together with their uncertainties and complete the table below. Quantity (and unit) Capacity of the cup (mL) Height of Mr Edwards (cm) Mass of size ‘D’ battery (g) Time taken for ping pong ball to drop 2m (s) Length of the longest side of one index card (cm) Temperature of tap water (˚C) Value Uncertainty Repeating measurements We can be more and more confident of our measurements if we repeat them multiple times. When we repeat measurements multiple times we take a mean average of the measured values. The true value is likely to be close to the mean. We calculate a mean by summing (adding) the values and dividing by the number of values. We state the uncertainty as ± half the range of measured values. We find the range by taking the largest measured value and subtracting the smallest measured value. For example, if the mass of a particular apple is measured 5 times as 160 g, 162 g, 165 g, 161 g and 166 g we can calculate our mean by summing the 5 values and dividing by 5, i.e. mean average = [ 160 + 162 + 165 + 161 + 166 ] ÷ 5 = 162.8 g To determine the uncertainty, we must find our range by taking the largest measured value (166 g) and subtracting the smallest measured value (160 g). Remember the uncertainty is ± half the range, i.e. uncertainty = range ÷ 2 = [ 166 – 160 ] ÷ 2 = ± 3 g In a results table we would display our data like this: Mass of Apple (g) Trial 1 Trial 2 Trial 3 Trial 4 Trial 5 160 162 165 161 166 Mean Uncertainty average 162.8 ±3 We usually round the absolute uncertainty to 1 s.f. and the value of the measurement to the same number of decimal places. Thus we can state the mass of the apple as: 163 ± 3 g Task 3 – Calculating means and uncertainties from repeated measurements Let’s share our data as a class and use the data to calculate mean averages and uncertainties. Quantity (and unit) Capacity of the cup (mL) Height of Mr Edwards (cm) Mass of size ‘D’ battery (g) Time taken for ping pong ball to drop 2m (s) Length of the longest side of one index card (cm) Temperature of tap water (˚C) Trial 1 Trial 2 Trial 3 Trial 4 Trial 5 Mean average Uncertainty


