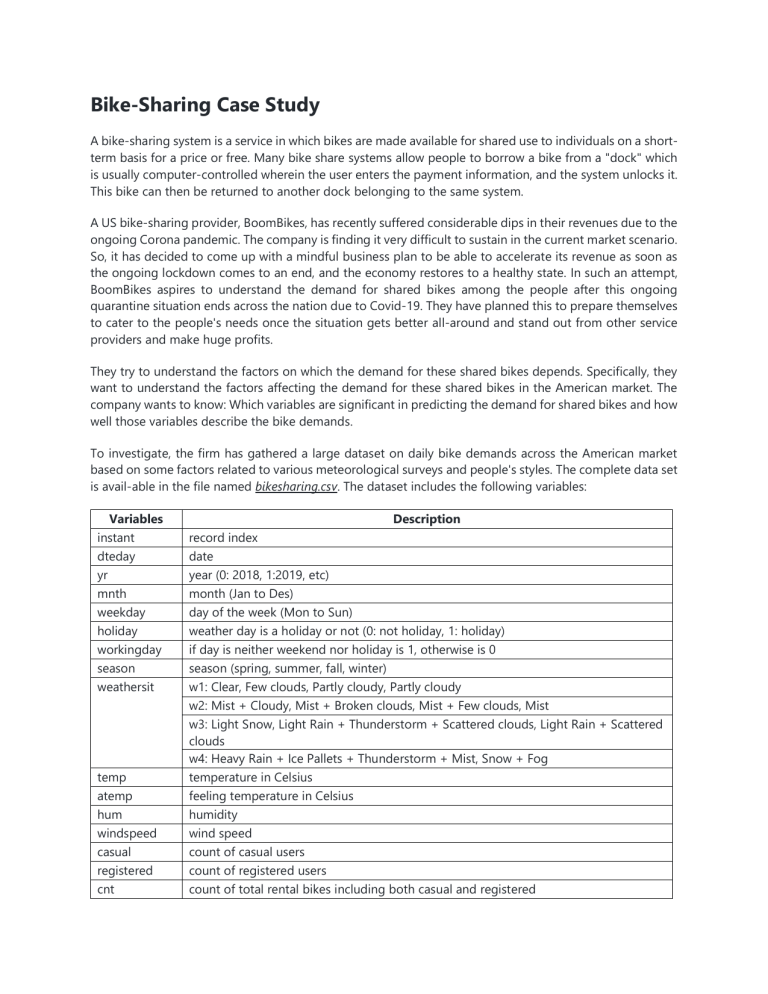
Bike-Sharing Case Study A bike-sharing system is a service in which bikes are made available for shared use to individuals on a shortterm basis for a price or free. Many bike share systems allow people to borrow a bike from a "dock" which is usually computer-controlled wherein the user enters the payment information, and the system unlocks it. This bike can then be returned to another dock belonging to the same system. A US bike-sharing provider, BoomBikes, has recently suffered considerable dips in their revenues due to the ongoing Corona pandemic. The company is finding it very difficult to sustain in the current market scenario. So, it has decided to come up with a mindful business plan to be able to accelerate its revenue as soon as the ongoing lockdown comes to an end, and the economy restores to a healthy state. In such an attempt, BoomBikes aspires to understand the demand for shared bikes among the people after this ongoing quarantine situation ends across the nation due to Covid-19. They have planned this to prepare themselves to cater to the people's needs once the situation gets better all-around and stand out from other service providers and make huge profits. They try to understand the factors on which the demand for these shared bikes depends. Specifically, they want to understand the factors affecting the demand for these shared bikes in the American market. The company wants to know: Which variables are significant in predicting the demand for shared bikes and how well those variables describe the bike demands. To investigate, the firm has gathered a large dataset on daily bike demands across the American market based on some factors related to various meteorological surveys and people's styles. The complete data set is avail-able in the file named bikesharing.csv. The dataset includes the following variables: Variables instant dteday yr mnth weekday holiday workingday season weathersit temp atemp hum windspeed casual registered cnt Description record index date year (0: 2018, 1:2019, etc) month (Jan to Des) day of the week (Mon to Sun) weather day is a holiday or not (0: not holiday, 1: holiday) if day is neither weekend nor holiday is 1, otherwise is 0 season (spring, summer, fall, winter) w1: Clear, Few clouds, Partly cloudy, Partly cloudy w2: Mist + Cloudy, Mist + Broken clouds, Mist + Few clouds, Mist w3: Light Snow, Light Rain + Thunderstorm + Scattered clouds, Light Rain + Scattered clouds w4: Heavy Rain + Ice Pallets + Thunderstorm + Mist, Snow + Fog temperature in Celsius feeling temperature in Celsius humidity wind speed count of casual users count of registered users count of total rental bikes including both casual and registered Managerial Report: Suppose that you have been hired by the commissioner of the BoomBikes to model the demand for shared bikes with the available independent variables. It will be used by the management to understand how exactly the demands vary with different features. They can accordingly manipulate the business strategy to meet the demand levels and meet the customer's expectations. Further, the model will be a good way for management to understand the demand dynamics of a new market. Use methods of descriptive statistics to summarize the data and multiple linear regression to model and analyze the data. Prepare a report that summarizes your analysis, including key statistical results, conclusions, and recommendations. Predict the number of rental bikes at 25-Dec-2022, in a location with spring season, estimated temperature 12o Celsius, feeling temperature about 14o Celsius, weather condition is partly cloudy, humidity 70% and wind speed 12 Km/hour.
