1
Inverter performance prediction
L. Kaci1, A. Hadj Arab2, R. Zirmi1, S. Semaoui2 and S. Boulahchiche2
1
Centre de Développement des Energies Renouvelables, CDER, BP 62 Route de l'Observatoire, Algiers Algeria
2
Université Mouloud Mammeri, Tizi Ouzou, Algeria
Abstract— based on the outdoor PV system of the CDER at the
height of Algiers the inverter efficiency under field conditions has
been analyzed and compared to manufacturer data.
A model is developed that expresses the inverter efficiency as a
function of the inverter AC output power. Model parameters are
calculated using field data. The model is used to predict inverter
efficiencies for different periods of time and compared to the
measured ones.
Index Terms—Inverter electrical conversion efficiency, PV
system
I. INTRODUCTION
T
he cost reduction in photovoltaic technology coupled to
environmental concerns, led to an important increase in
the installed PV systems worldwide, it shows the PV
technology will play an important role in the energy mix. The
additional installed photovoltaic PV capacity worldwide (98
GW) an increase of up to 29 % compared to 2016, bringing
the cumulative installed capacity to 402.5 GW [1].
The estimation of the payback time and the profitability of
grid-connected photovoltaic (PV) systems require information
about performance of PV modules and inverters. For this
reason, the attention is strongly paid on the efficiency.
The performance of a PV system depends on the
performances of its components namely, PV modules and
inverters. Energy losses are present in all solar energy
conversion process. Specifically, losses can be categorized
into pre-module losses, module losses and system losses. A
PV system comprises three main units: the PV generator unit,
the string combiner unit and the power conditioning system.
The PV generator unit is the PV array. The string combiner
unit includes the connections and wiring between strings as
well as the fuses/block diodes, which are employed for string
overcurrent protection. Finally, the main parts of the power
conditioning system are the inverters, AC connections and
wiring. All three units are associated with operational losses
[2]
Increasing the performance of PV systems is one of the
main goals of research [3]; to increase the amount of
electricity produced per Wp installed PV capacity. To achieve
such goal we need to understand power losses that occur in the
installed PV systems. Losses due to the energy conversion by
PV cell need a technology breakthrough in the PV components
to be reduced, other losses are unavoidable such us shading.
Inverters are key components in a grid connected PV
Submission date April 5th 2020
system; they influence system performance to a great extent, a
small improvement in their efficiency will reduce the overall
cost of the system significantly.
PV inverters consists of variety of components such as
power semiconductors, sensors, resistors, magnetics and
control circuits those components introduce an amount of
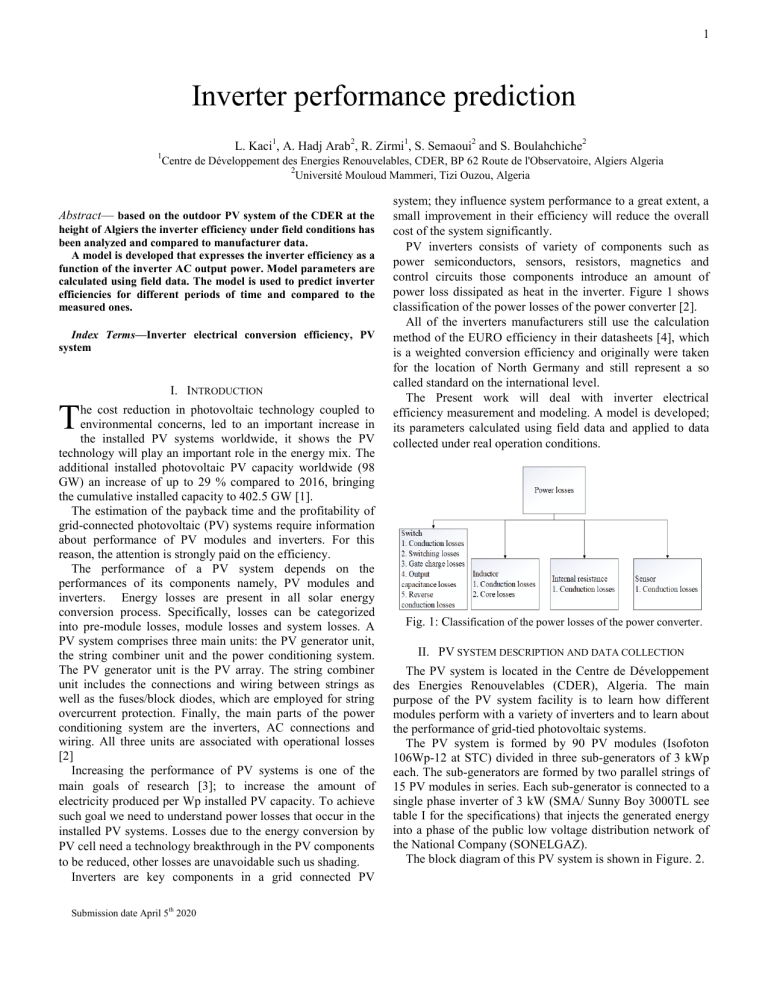
power loss dissipated as heat in the inverter. Figure 1 shows
classification of the power losses of the power converter [2].
All of the inverters manufacturers still use the calculation
method of the EURO efficiency in their datasheets [4], which
is a weighted conversion efficiency and originally were taken
for the location of North Germany and still represent a so
called standard on the international level.
The Present work will deal with inverter electrical
efficiency measurement and modeling. A model is developed;
its parameters calculated using field data and applied to data
collected under real operation conditions.
Fig. 1: Classification of the power losses of the power converter.
II. PV SYSTEM DESCRIPTION AND DATA COLLECTION
The PV system is located in the Centre de Développement
des Energies Renouvelables (CDER), Algeria. The main
purpose of the PV system facility is to learn how different
modules perform with a variety of inverters and to learn about
the performance of grid-tied photovoltaic systems.
The PV system is formed by 90 PV modules (Isofoton
106Wp-12 at STC) divided in three sub-generators of 3 kWp
each. The sub-generators are formed by two parallel strings of
15 PV modules in series. Each sub-generator is connected to a
single phase inverter of 3 kW (SMA/ Sunny Boy 3000TL see
table I for the specifications) that injects the generated energy
into a phase of the public low voltage distribution network of
the National Company (SONELGAZ).
The block diagram of this PV system is shown in Figure. 2.
2
TABLE I
SMA/ SUNNY BOY 3000TL SPECIFICATIONS
DC input
Fig. 2: Schematic diagram of the CDER grid connected PV system.
The CDER PV system is fully instrumented which allow
performance analysis of both PV array and inverters, it is
monitored at five minute intervals, five-minute average
performance data was recorded for the CDER PV system for
up to one year of operation.
III. INVERTER EFFICIENCY MODELS
Inverter efficiency calculation and modeling is very
important for the following reasons:
Optimum yield of expensive PV energy
Criteria for purchase decision
Indicator for innovation capability of the inverter
manufacturer
It can be used in conjunction with a photovoltaic
array performance to calculate expected system
performance.
Inverter manufacturer’s published data generally lists the
conversion efficiencies under optimal conditions; figure 3
shows measured inverter efficiencies versus output power at
three different input voltages VDC of the SMA/ Sunny Boy
5000TL PV inverter (Based on manufacturers data).
Conversion efficiencies under optimal conditions can be
misleading as the optimal efficiencies are not maintained over
the whole range of operation. Inverter performance models
have been proposed to continuously monitor efficiencies that
may indicate need for repair or maintenance.
Maximum DC power at cos φ = 1
Maximum DC voltage*
MPP voltage range at AC nominal power
DC nominal voltage
Minimum DC voltage
Start voltage, adjustable
Maximum input current
Maximum input current per string
Number of MPP trackers
Strings per MPP tracker
AC output
AC nominal power at 230 V, 50 Hz
Maximum AC apparent power
Nominal AC frequency
Nominal AC current at 220 V / 230 V / 240 V
Maximum AC current
Total harmonic distortion of output current at
AC THD voltage < 2 %, AC power > 0.5 AC
nominal power
AC voltage range*
Nominal AC frequency*
Operating range at nominal AC
frequency 50 Hz
Operating range at nominal AC
frequency 60 Hz
cos φ at nominal AC power
3,200 W
550 V
188 V … 440 V
400 V
125 V
150 V
17 A
17 A
1
2
3,000 W
3,000 VA
220 V / 230 V / 240 V
13.6 A / 13 A / 12.5 A
16 A
≤3%
180 V … 280 V
50 Hz / 60 Hz
45 Hz … 55 Hz
55 Hz … 65 Hz
1
Supply phases
1
Connection phases
1
Overvoltage category**
III
* Depends on country configuration
** Voltage surge resistance in accordance with IEC 60664-1
Power losses in the inverter Ploss and conversion efficiency
of the inverter ηinv are calculated from two fundamental
measurements namely the actual power delivered to the
output, Pac, and the input power from the generator Pdc. There
are various mays to express the relationship between these
variables.
𝜂𝑖𝑛𝑣 = 𝑓(𝑃𝑎𝑐 , 𝑉𝑑𝑐 )
𝜂𝑖𝑛𝑣 = 𝑓(𝑃𝑑𝑐 , 𝑉𝑑𝑐 )
𝑃𝑙𝑜𝑠𝑠 = 𝑓(𝑃𝑎𝑐 , 𝑉𝑑𝑐 )
𝑃𝑙𝑜𝑠𝑠 = 𝑓(𝑃𝑑𝑐 , 𝑉𝑑𝑐 )
𝑃𝑎𝑐 = 𝑓(𝑃𝑑𝑐 , 𝑉𝑑𝑐 )
(1)
Where 𝑉𝑑𝑐 in the output voltage from the generator.
Fig. 3. Example of efficiency data available from the CEC.
These curves are for SMA/ Sunny Boy 5000TL
A. Euro model:
Efficiency varies for an inverter depending on the input
power from the generator Pdc; so instead of looking at the
efficiency when the inverter is operating at its rated capacity;
calculating weighted efficiency requires selecting a few DC
input levels relative to the inverter’s rated capacity. European
(EU) efficiency and California Energy Commission (CEC)
inverter efficiency, these types of efficiency are ‘weighted’
efficiencies.
3
European efficiency is widely used all over the world for
grid-connected inverter comparison; it is weighted conversion
efficiency. The European conversion efficiency combines the
weighed inverter efficiency at six points of operation, at
nominal DC voltages.
𝜂𝐸𝑈𝑅𝑂 = 0.03 ∙ 𝜂5% + 0.06 ∙ 𝜂10% + 0.13 ∙ 𝜂20% +
0.10 ∙ 𝜂30% + 0.48 ∙ 𝜂50% + 0.20 ∙ 𝜂100% (2)
Where 𝜂𝑖% is the conversion efficiency at i% of the inverter
output rated power [5].
The European efficiency is mainly used as a reference for
comparison between different inverters; it is not used for
continuous monitoring of inverter efficiency.
B. SANDIA model:
Inverter efficiency, ηinv, derives from the ratio between the
actual power delivered to the output, Pac, and the input power
from the generator Pdc. The difference between Pdc and Pac,
Ploss is converted to heat inside the inverter.
The quadratic function
2
𝑃𝑙𝑜𝑠𝑠 = 𝑎0 + 𝑎1 . 𝑃𝑎𝑐 + 𝑎2 . 𝑃𝑎𝑐
(3)
Fig. 4: Field test results for a 3-kWp SMA/ Sunny Boy 3000TL
inverter recorded during system operation at CDER
C. DRIESSE model:
Sandia model uses true voltages and power values which
will lead to parameters values that span several orders of
magnitude. To overcome this problem Driesse& al proposed
normalization of the measured data.
Power can be normalized to the nominal maximum rating,
𝑃𝑛𝑜𝑟𝑚 (usually output power) [6]; and input voltage can be
normalized to a nominal input voltage, 𝑉𝑛𝑜𝑟𝑚 giving the form:
𝑃𝑙𝑜𝑠𝑠
𝑃𝑛𝑜𝑟𝑚
Provide a good fit for empirical data [6]
Efficiency of the inverter is calculated as follows
𝜂𝑖𝑛𝑣 = 𝑃𝑎𝑐 /(𝑃𝑎𝑐 + 𝑃𝑙𝑜𝑠𝑠 )
(4)
Sandia model expresses 𝑃𝑎𝑐 as a function of 𝑃𝑑𝑐
𝑃𝑎𝑐 = {(
𝑃𝑎𝑐𝑜
𝐴−𝐵
) – 𝐶 ⋅ (𝐴 − 𝐵)} ⋅ (𝑃𝑑𝑐 − 𝐵) + 𝐶 ⋅ (𝑃𝑑𝑐 – 𝐵)2
(5)
Where
𝐴 = 𝑃𝑑𝑐𝑜 ⋅ {1 + 𝐶1 ⋅ (𝑉𝑑𝑐 − 𝑉𝑑𝑐𝑜 )}
𝐵 = 𝑃𝑠𝑜 ⋅ {1 + 𝐶2 ⋅ (𝑉𝑑𝑐 − 𝑉𝑑𝑐𝑜 )}
𝐶 = 𝐶𝑜 ⋅ {1 + 𝐶3 ⋅ (𝑉𝑑𝑐 − 𝑉𝑑𝑐𝑜 )}
We can see from the equation (3) above that it is a quadratic
function just like equation (1). 𝑃𝑑𝑐𝑜 is the rated DC power,
𝑃𝑎𝑐𝑜 the rated AC power and 𝑃𝑠𝑜 the self-consumption are
directly for the inverter specification data sheet [6]. Co is a
parameter defining the curvature (parabolic) of the
relationship between ac-power and dc-power at the reference
operating condition, default value of zero gives a linear [6].
The performance model was very effective in fitting
measured data for inverters Xantrex GT3.8 and PVP3200 with
a standard error in measured versus modeled efficiency of
about 0.1% [7]. And the model was also very effective with
SMA/ Sunny Boy 3000TL [1].
Relations between 𝑃𝑑𝑐 vs 𝑃𝑎𝑐 and 𝑃𝑑𝑐 vs 𝜂𝑖𝑛𝑣 are illustrated
in fig 4 using field data of the CDER PV system with
hundreds of measurements recorded over a 5-days period from
September 1st 2018 to September 5th 2018.
𝑃𝑑𝑐
= 𝑓(𝑃
𝑛𝑜𝑟𝑚
𝑉𝑑𝑐
,𝑉
𝑛𝑜𝑟𝑚
)
(6)
This model is essentially the double quadratic model
expressing this in normalized form, and using voltage
deviation from nominal rather than absolute voltage, gives the
equation:
𝑃𝑙𝑜𝑠𝑠 = (𝑏(0,0) + 𝑏(0,1) (1 − 𝑣𝑑𝑐 ))
+ (𝑏(1,0) + 𝑏(1,1) (1 − 𝑣𝑑𝑐 )) 𝑝𝑑𝑐
2
+ (𝑏(2,0) + 𝑏(2,1) (1 − 𝑣𝑑𝑐 )) 𝑝𝑑𝑐
(7)
This model was successfully tested with the California
Energy Commission (CEC) data for 12 different inverters and
achieved a very good accuracy[6].
IV. PROPOSED MODEL
In field testing the inverter performance data recorded are
completely representative of the actual system operating
conditions.
The two fundamental measurements, to calculate the
inverter performance are 𝑃𝑑𝑐 the input power from generator
and 𝑃𝑎𝑐 the output power from inverter that are available in
field installed PV system.
Most of the existing models departs from the quadratic
function equation (3) to estimate PV inverter efficiency; our
proposed model will use the double exponential as it is clear
from 𝜂𝑖𝑛𝑣 versus 𝑃𝑎𝑐 curve (fig 5) that 𝜂𝑖𝑛𝑣 (𝑃𝑎𝑐 ) is of the
following form.
𝜂𝑖𝑛𝑣 (𝑃𝑎𝑐 ) = 𝛼1 . 𝑒 𝛽1.𝑃𝑎𝑐 + 𝛼2 . 𝑒 𝛽2.𝑃𝑎𝑐
(7)
Where 𝛼1 , 𝛽1 , 𝛼2 and 𝛽2 are constants to be determined.
4
Figure 5 illustrates a field test carried out at the CDER
facility with hundreds of measurements recorded over a 6days period.
The coefficients 𝛼1 ,𝛽1 , 𝛼2 and 𝛽2 must be found by fitting
the function to the measured field data. The fit is done using
the least square method, MATLAB software is used. Results
are shown in table II
TABLE II
PARAMETERS OF THE MODEL
Parameters
Values
𝛼1
𝛽1
𝛼2
𝛽2
0.9885
-1.56E-05
-0.6678
-0.02325
Goodness of fit:
SSE: 0.3249
R-square: 0.9426
Adjusted R-square: 0.9423
RMSE: 0.02428
Where :
Sum of Squares Due to Error (SSE): It measures the total
deviation of the response values from the fit to the response
values. The closer its value to 0 the better is the fit.
R-Square.: This statistic measures how successful the fit is in
explaining the variation of the data, a value closer to 1
indicating a better fit.
Root Mean Squared Error: This statistic is also known as the
fit standard error. RMSE value closer to 0 indicates a better fit
[8].
Fig. 7: Model residual plot
V. MODEL VALIDATION
This model is tested using the CDER facility PV system
using the SMA/ Sunny Boy 3000TL single phase inverter.
Model parameters are shown in table II they are calculated
using 5-days period data from September 1st 2018 to
September 5th 2018. Validation data used are from 5-days
period of November and December.
Results for November are shown Figure 8, residuals are
shown in figure 9 and figure 10 shows a linear regression of
estimated efficiency 𝜂𝑖𝑛𝑣 versus measured efficiency.
Fig. 8: 𝜂𝑖𝑛𝑣 Versus 𝑃𝑎𝑐 curve estimated and measured 5-days
period November
Fig. 6: 𝜂𝑖𝑛𝑣 Versus 𝑃𝑎𝑐 curve
Model residual plot is shown in Figure. 7 the difference
between the measured efficiencies and the predicted
efficiencies using the prediction equation (7). As we can see
the data points for Pac greater than 100 W the residual is
around zero.
Model residual plot shown in Figure. 9 describes the
difference between the measured efficiencies and the predicted
efficiencies using the prediction equation (7) with the
calculated parameters in table II. As we can see the data
points for Pac greater than 100 W the residual is around zero
almost the same as for the September data used for parameters
calculation.
5
Fig. 9: 𝜂𝑖𝑛𝑣 measured residual plot (Nov)
Fig. 13: 𝜂𝑖𝑛𝑣 estimated versus 𝜂𝑖𝑛𝑣 measured linear regression
(December)
VI. CONCLUSION
Fig. 10: 𝜂𝑖𝑛𝑣 estimated versus 𝜂𝑖𝑛𝑣 measured linear regression
November
Results for December are shown Figure 11 residuals are
shown in figure 12 and figure 13 shows a linear regression of
estimated efficiency 𝜂𝑖𝑛𝑣 versus measured efficiency
High-resolution (five minutely) performance data, recorded
for the CDER PV system over a 1- year period, model has
been used to construct simple empirical model of the
performance of the SMA/ Sunny Boy 3000TL Inverter during
normal operation.
This paper describe a new model for inverter electrical
conversion efficiency whose parameters are calculated using
only measured actual power delivered to the output, Pac, and
the input power from the generator Pdc ; measurements that are
available in field.
Once the inverter model 𝜂𝑖𝑛𝑣 = 𝑓(𝑃𝑎𝑐 ) parameters
calculated, they are used to predict efficiency for other periods
of the year namely November 2018 and December2018.
The model very effective with SMA/ Sunny Boy 3000TL and
as future work it will be tested on other types of inverters. .
By incorporating inverter performance model in the process
of PV monitoring system it will allow users to continuously
monitor the inverter efficiency and it’s deviation from the
estimated efficiency. This will help in diagnose causes of
inverter performance degradation, and facilitate expedient
and cost-effective field maintenance as well as need for
repair and maintenance [7].
REFERENCES
Fig. 11: 𝜂𝑖𝑛𝑣 Versus 𝑃𝑎𝑐 curve estimated and measured 5-days
period December
[1]
[2]
[3]
[4]
[5]
Fig. 12: 𝜂𝑖𝑛𝑣 measured residual plot (December)
A. Hadj Arab & al“ Analyse des performances des
onduleurs du système photovoltaïque connecté au réseau du
”. Revue des Energies Renouvelables Vol. 22 N°1 (2019)
123 – 134
Elena Koumpli“Impact of data quality on photovoltaic (PV)
performance assessment” A Doctoral thesis Loughborough
University. November 2017.
S.K. Firth & al “A simple model of PV system performance
and its use in fault detection” Solar Energy 84 (2010) 624–
635.
F.P. Baumgartner, “euro realo inverter efficiency: dcvoltage dependency” 20th European photovoltaic solar
energy conference, 6-10 June 2005; Barcelona, Spain
assimo Valentini “PV Inverter Test Setup for European
efficiency, Static and Dynamic MPPT Efficiency
Evaluation”. Conference Paper · June 2008 DOI:
10.1109/OPTIM.2008.4602445 · Source: IEEE Xplore
6
Anton Driesse, Praveen Jain “beyond the curves: modeling
the electrical efficiency Of photovoltaic inverters” 2008
[7] David L. King & al “Performance Model for GridConnected Photovoltaic Inverters” SANDIA REPORT
SAND2007-5036 Unlimited Release Printed September
2007.
[8] Mathworks user guide “Curve Fitting Toolbox” p 29
[9] Adarsh Nagarajan & al “Photovoltaic Inverter Reliability
Assessment”. Technical Report NREL/TP-5D00-74462
October 2019
[10] BENDIB D, “Experimental setup for testing
commercial pv inverters” Conference Paper · December
2015
[6]


