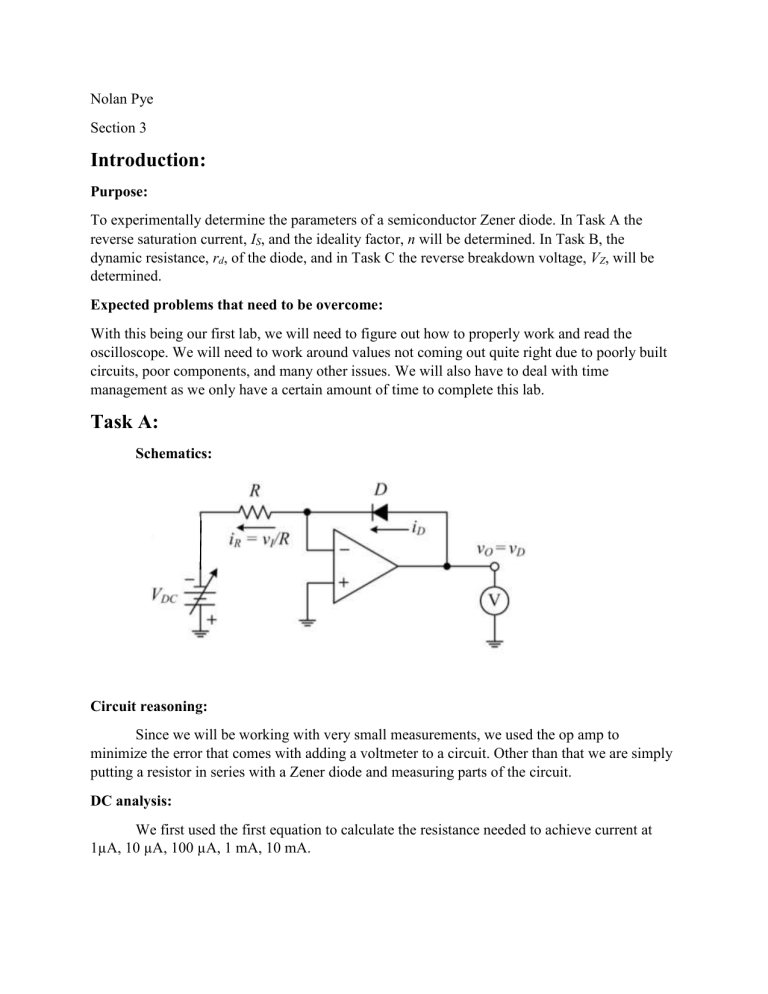
Nolan Pye Section 3 Introduction: Purpose: To experimentally determine the parameters of a semiconductor Zener diode. In Task A the reverse saturation current, IS, and the ideality factor, n will be determined. In Task B, the dynamic resistance, rd, of the diode, and in Task C the reverse breakdown voltage, VZ, will be determined. Expected problems that need to be overcome: With this being our first lab, we will need to figure out how to properly work and read the oscilloscope. We will need to work around values not coming out quite right due to poorly built circuits, poor components, and many other issues. We will also have to deal with time management as we only have a certain amount of time to complete this lab. Task A: Schematics: Circuit reasoning: Since we will be working with very small measurements, we used the op amp to minimize the error that comes with adding a voltmeter to a circuit. Other than that we are simply putting a resistor in series with a Zener diode and measuring parts of the circuit. DC analysis: We first used the first equation to calculate the resistance needed to achieve current at 1µA, 10 µA, 100 µA, 1 mA, 10 mA. 𝑅= 𝑉𝐷𝐶 𝐼𝐷 We used this equation to solve for VT 𝑉𝑇 = 𝑘𝑇 = 0.0259𝑉 𝑞 We used the following equation to solve for ID at each value 𝐼𝐷 = 𝑉𝐷𝐶,𝑒𝑥𝑝 𝑅𝑛𝑜𝑚 We then compared our line of best fit of the graph below to the last equation to solve for our n and IS values. log10 𝐼𝐷 = log10 𝑒 𝑉 + log10 𝐼𝑆 𝑛𝑉𝑇 𝐷 Data table: Semi-log graph with best fit linear equations: Values of n and Is: n = 0.9413 Is = 8.317 x10⁻¹⁶ A Discussion of results (Do experimental and expected results match?): Our results were acceptable. The only part that threw us off was our final data point being a bit of an outlier. Upon discussion with the TA and my partner, we decided it was likely faulty equipment or components that caused the discrepancy. Task B: Schematics for new circuits/modifications: Circuit reasoning: The output voltage of the circuit is to be measured with the same resistors as Task A, but with an input of a sine wave at 1 kHz, 400 mVpp, and -1 V offset. Resistance will be measured using the equations for rd,theo and rd,exp. AC analysis (diode small signal model and equations): 𝑟𝑑,𝑡ℎ𝑒𝑜 = 𝑟𝑑,𝑒𝑥𝑝 = 𝑛𝑉𝑇 𝐼𝐷 𝑉𝑑𝑖𝑜𝑑𝑒,𝑝𝑝 𝑉𝑖𝑛,𝑝𝑝 ⁄ 𝑅 1 𝐼𝐷 = 𝑅 (due to -1V offset) Oscilloscope plots to demonstrate measurements taken: Data Table: Example calculations of rd,theo and rd,exp: 𝑟𝑑,𝑡ℎ𝑒𝑜 = 𝑟𝑑,𝑒𝑥𝑝 = 𝑛𝑉𝑇 0.2438 = = 9.45 𝑘Ω 𝐼𝐷 2.58 𝑥 10−6 𝑉𝑑𝑖𝑜𝑑𝑒,𝑝𝑝 𝑉𝑖𝑛,𝑝𝑝 ⁄ 𝑅 12.35 𝑥 10−3 = 390 𝑥 10−3 ⁄ 378 𝑥 103 = 11.97 𝑘Ω Log-log graph of ID vs. rd,theo and rd,exp on same axes: Discussion of results: Our results are acceptable. Our experimental resistance is consistently higher than our theoretical resistance. This is likely due to mismeasurements on the equipment or the contruction of the diode. Task C: Schematic of test circuit: Calculation to find value of R: 𝑅= −4.04 = 3.88 𝑘Ω −1 𝑚𝐴 Measured value of Zener reverse breakdown voltage: -4.9 V Discussion: The current voltage (Vo) when Vin stops increasing is the breakdown voltage of the Zener voltage. Summary/Conclusions: Comments on methods and non-ideal effects (expected and observed): Our expected versus observed values were a little bit off each time, but for the most part were close enough. Our differences were likely due to the tolerances of the resistors, measurements of multimeter or the construction of the diodes. Comments on results (Were expectations verified? How do diodes work?): Our results were what we expected. We learned that diodes only let current flow in one direction, but the Zener diodes we worked with work in the reverse bias and have a certain breakdown point. Comments on experience (What did you learn?): I certainly learned how to better use all the equipment. We had issues working the oscilloscope at first, but then once we learned how to use averaging and other adjustments, we had clean plots.
