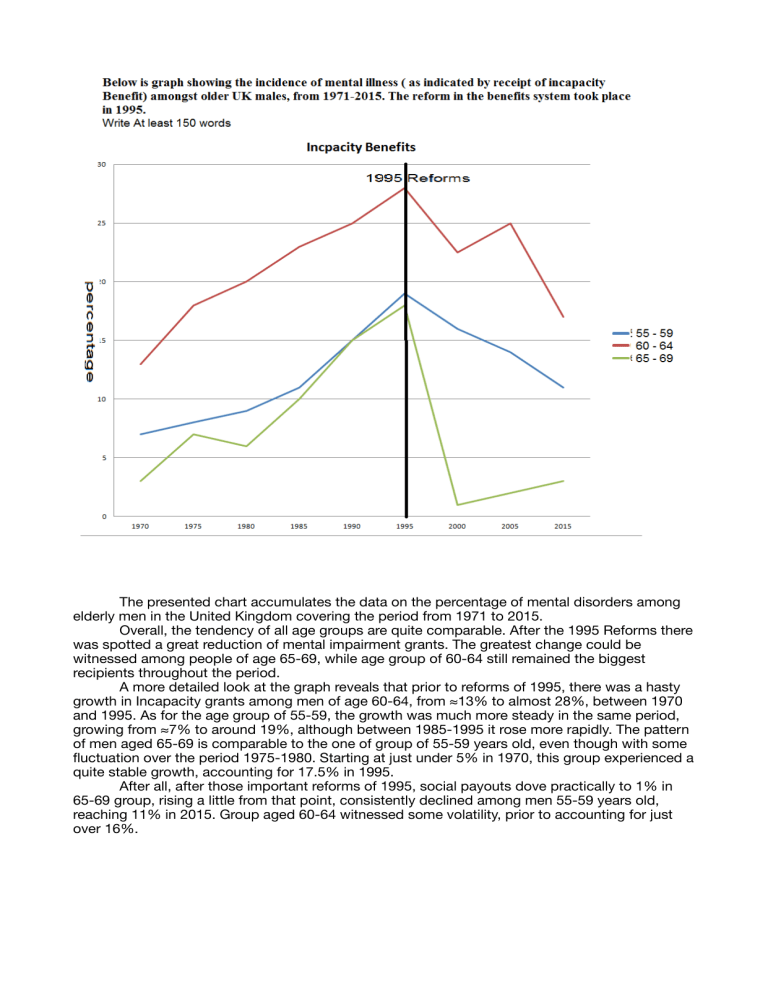
fl The presented chart accumulates the data on the percentage of mental disorders among elderly men in the United Kingdom covering the period from 1971 to 2015. Overall, the tendency of all age groups are quite comparable. After the 1995 Reforms there was spotted a great reduction of mental impairment grants. The greatest change could be witnessed among people of age 65-69, while age group of 60-64 still remained the biggest recipients throughout the period. A more detailed look at the graph reveals that prior to reforms of 1995, there was a hasty growth in Incapacity grants among men of age 60-64, from ≈13% to almost 28%, between 1970 and 1995. As for the age group of 55-59, the growth was much more steady in the same period, growing from ≈7% to around 19%, although between 1985-1995 it rose more rapidly. The pattern of men aged 65-69 is comparable to the one of group of 55-59 years old, even though with some uctuation over the period 1975-1980. Starting at just under 5% in 1970, this group experienced a quite stable growth, accounting for 17.5% in 1995. After all, after those important reforms of 1995, social payouts dove practically to 1% in 65-69 group, rising a little from that point, consistently declined among men 55-59 years old, reaching 11% in 2015. Group aged 60-64 witnessed some volatility, prior to accounting for just over 16%.


