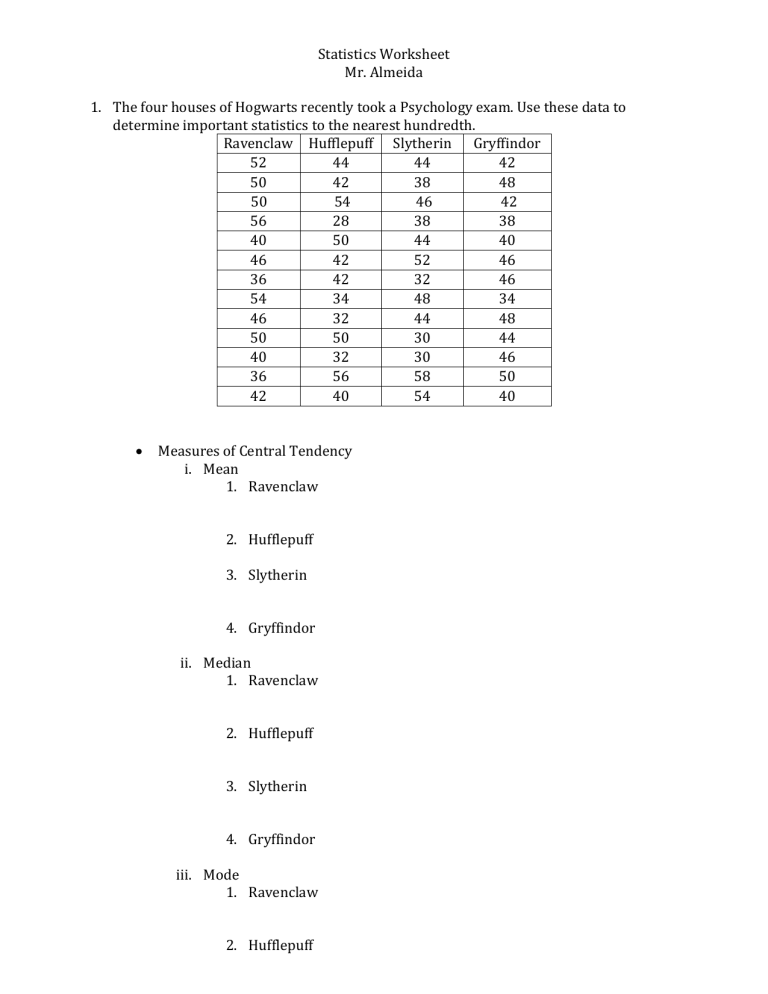
Statistics Worksheet Mr. Almeida 1. The four houses of Hogwarts recently took a Psychology exam. Use these data to determine important statistics to the nearest hundredth. Ravenclaw Hufflepuff Slytherin Gryffindor 52 44 44 42 50 42 38 48 50 54 46 42 56 28 38 38 40 50 44 40 46 42 52 46 36 42 32 46 54 34 48 34 46 32 44 48 50 50 30 44 40 32 30 46 36 56 58 50 42 40 54 40 Measures of Central Tendency i. Mean 1. Ravenclaw 2. Hufflepuff 3. Slytherin 4. Gryffindor ii. Median 1. Ravenclaw 2. Hufflepuff 3. Slytherin 4. Gryffindor iii. Mode 1. Ravenclaw 2. Hufflepuff 3. Slytherin 4. Gryffindor Measures of Variability i. Range 1. Ravenclaw 2. Hufflepuff 3. Slytherin 4. Gryffindor 2. Is determined that the Standard Deviations for test scores in each house are as follows: Ravenclaw: 4 Hufflepuff: 3 Slytherin: 6.5 Gryffindor: 4.1 Which house as the widest variation in test scores? Using the means (averages) you just calculated for each house, interpret what these standard deviations represent for Hufflepuff and Slytherin (compare/contrast the two). 3. It is determined that the average test score for ALL Hogwarts students is a 44, with a standard deviation of 4. Draw (you can use a program like Microsoft Paint) a normally distributed curve. Using the mean and SD, label the test scores at μ(mean/average), and at 1σ, 2σ, and 3σ, and at -1σ, -2σ and -3σ. Answer the following questions: i. What percentage of Hogwarts students earned a score between 40 and a 48? ii. What percentage of Hogwarts students earned a score of 44 or greater? iii. What percentage of Hogwarts students earned a score of less than 36? iv. What percentage of Hogwarts student earned a score of 40 and above?


