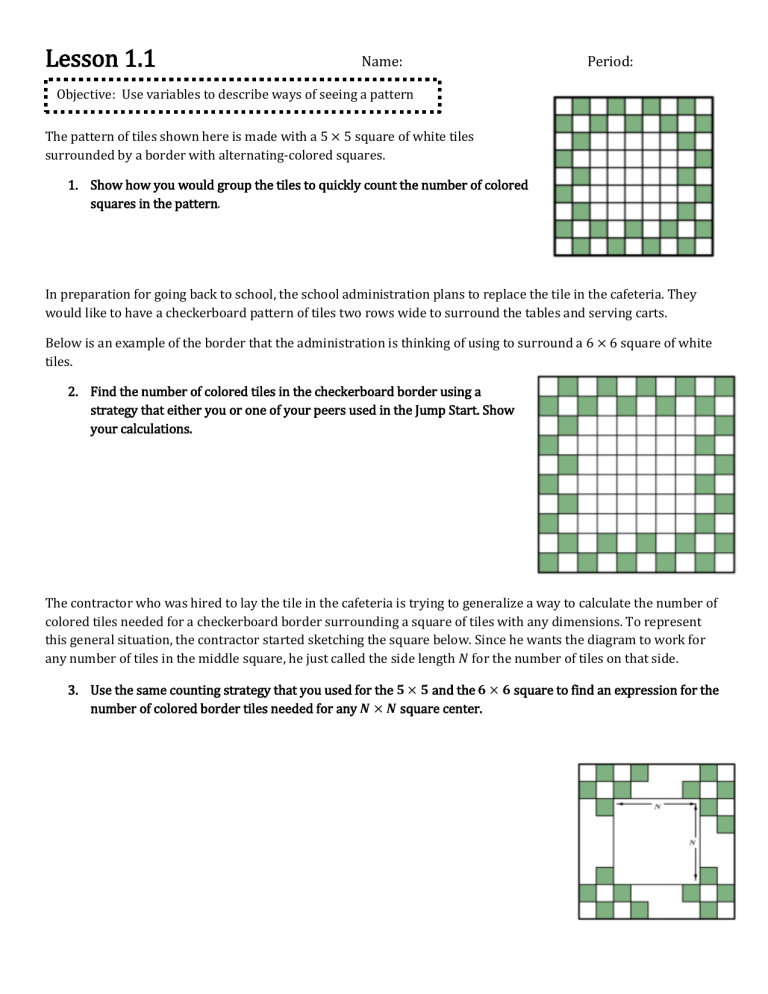
Lesson 1.1 Name: Period: Objective: Use variables to describe ways of seeing a pattern The pattern of tiles shown here is made with a 5 × 5 square of white tiles surrounded by a border with alternating-colored squares. 1. Show how you would group the tiles to quickly count the number of colored squares in the pattern. In preparation for going back to school, the school administration plans to replace the tile in the cafeteria. They would like to have a checkerboard pattern of tiles two rows wide to surround the tables and serving carts. Below is an example of the border that the administration is thinking of using to surround a 6 × 6 square of white tiles. 2. Find the number of colored tiles in the checkerboard border using a strategy that either you or one of your peers used in the Jump Start. Show your calculations. The contractor who was hired to lay the tile in the cafeteria is trying to generalize a way to calculate the number of colored tiles needed for a checkerboard border surrounding a square of tiles with any dimensions. To represent this general situation, the contractor started sketching the square below. Since he wants the diagram to work for any number of tiles in the middle square, he just called the side length 𝑁 for the number of tiles on that side. 3. Use the same counting strategy that you used for the 𝟓 × 𝟓 and the 𝟔 × 𝟔 square to find an expression for the number of colored border tiles needed for any 𝑵 × 𝑵 square center. Find an expression to calculate the number of colored tiles in the two-row checkerboard border for any rectangle. Be prepared to share your strategy and justify your work. Create models to assist you in your work. Try these! Create a mathematical expression to represent your grouping strategy. Find the number of green tiles in a figure size 11. Turn one of your expressions into an equation that can be used to find the figure size number for a shape with 𝟐𝟏𝟗 green colored tiles. SM1Lab 1.1 Assignment Name: Period: Evaluate each expression using the given value. 1. 𝟏𝟎 − 𝟑𝒈, 𝒈 = 𝟓 2. Given: 𝟑𝒙 𝟒 − 𝟏𝟐, 𝒙 = 𝟖 For each set of figures, show how the green colored tiles in the border can be grouped to allow for quick calculation. Each set of figures has two figures of different sizes for you to work with; use a different grouping method on each and provide a mathematical expression that connects with your grouping method. 1. Create a mathematical expression to represent your grouping strategy. 2. Create a mathematical expression to represent your grouping strategy a. Find the number of green tiles in figure with side length 8. b. Turn one of your expressions into an equation that can be used to find the figure size number for a shape with 𝟕𝟐 green colored tiles. 3. Complete the tables of values. 𝑦 = 3𝑥 − 5 x y -1 0 1 2 3 4 4. Graph the points from the table on the graph. 𝑥 1 3 5 7 𝑦 16 13 10 7 9. Graph the points from the table on the graph 𝑥 0 4 7 9 𝑦 12 8 5 3
