Image Processing Homework: Fourier Transforms & Enhancement
advertisement

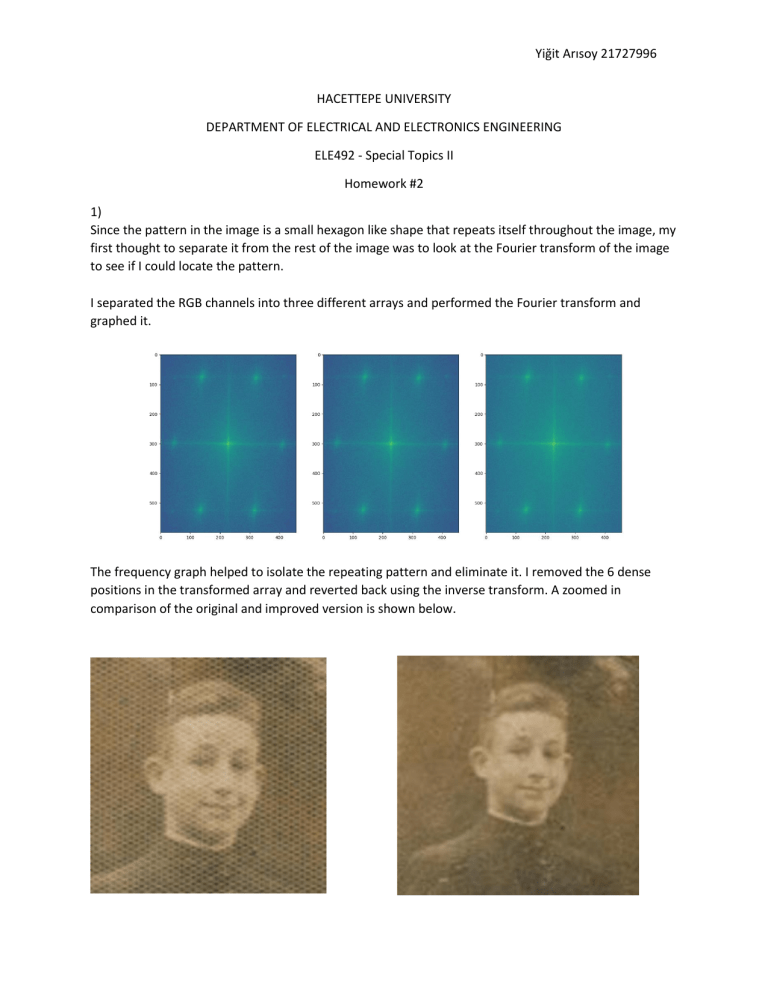
Yiğit Arısoy 21727996 HACETTEPE UNIVERSITY DEPARTMENT OF ELECTRICAL AND ELECTRONICS ENGINEERING ELE492 - Special Topics II Homework #2 1) Since the pattern in the image is a small hexagon like shape that repeats itself throughout the image, my first thought to separate it from the rest of the image was to look at the Fourier transform of the image to see if I could locate the pattern. I separated the RGB channels into three different arrays and performed the Fourier transform and graphed it. The frequency graph helped to isolate the repeating pattern and eliminate it. I removed the 6 dense positions in the transformed array and reverted back using the inverse transform. A zoomed in comparison of the original and improved version is shown below. Yiğit Arısoy 21727996 2) My first approach to finding the lost image was to enhance the edges in the image. I used various filters to accomplish this, like the Roberts, sobel and canny. However I wasn’t able to accomplish anything with this method. My second approach was to experiment with the exposure properties of the image. I tried to fine tune the image to find something with the gamma settings and the histogram equalization using skimage functions. I combined this with edge detectors and different parameters but it was not of much use. While I progressed, I didn’t come to any meaningful result. The lack of any visual clues in the original image led me to think that I might be able find something by doing these operations after inverting the original image instead. Inverted Image Yiğit Arısoy 21727996 With this I was able to find the image of what resembles an old man. The resulting image in different color formats Yiğit Arısoy 21727996 import numpy as np import matplotlib.pyplot as plt import random from skimage.io import imread,imsave old = imread("old.jpg") print(old.shape)a r_values = old[:, :, 0] g_values = old[:, :, 1] b_values = old[:, :, 2] f1 = np.fft.fft2(r_values) fshift1 = np.fft.fftshift(f1) phase_spectrum_r = np.angle(fshift1) magnitude_spectrum_r = 20*np.log(np.abs(fshift1)) f2 = np.fft.fft2(g_values) fshift2 = np.fft.fftshift(f2) phase_spectrum_g = np.angle(fshift2) magnitude_spectrum_g = 20*np.log(np.abs(fshift2)) f3 = np.fft.fft2(b_values) fshift3 = np.fft.fftshift(f3) phase_spectrum_b = np.angle(fshift3) magnitude_spectrum_b = 20*np.log(np.abs(fshift3)) plt.subplot(231) plt.imshow(magnitude_spectrum_r) plt.subplot(232) plt.imshow(magnitude_spectrum_g) plt.subplot(233) plt.imshow(magnitude_spectrum_b) fshift1[42:90, 125:155] = 1 fshift2[42:90, 125:155] = 1 fshift3[42:90, 125:155] = 1 fshift1[500:548, 125:155] = 1 Yiğit Arısoy 21727996 fshift2[500:548, 125:155] = 1 fshift3[500:548, 125:155] = 1 fshift1[500:548, 305:335] = 1 fshift2[500:548, 305:335] = 1 fshift3[500:548, 305:335] = 1 fshift1[42:90, 305:335] = 1 fshift2[42:90, 305:335] = 1 fshift3[42:90, 305:335] = 1 fshift1[290:310, 400:420] = 1 fshift2[290:310, 400:420] = 1 fshift3[290:310, 400:420] = 1 fshift1[270:330, 20:70] = 1 fshift2[270:330, 20:70] = 1 fshift3[270:330, 20:70] = 1 magnitude_spectrum_r = 20*np.log(np.abs(fshift1)) magnitude_spectrum_g = 20*np.log(np.abs(fshift2)) magnitude_spectrum_b = 20*np.log(np.abs(fshift3)) new_r = abs(np.fft.ifft2(fshift1)) new_g = abs(np.fft.ifft2(fshift2)) new_b = abs(np.fft.ifft2(fshift3)) new_r = new_r.clip(0,255) new_g = new_g.clip(0,255) new_b = new_b.clip(0,255) newPhoto = np.dstack([new_r.astype(int), new_g.astype(int), new_b.astype(int)]) imsave("newImproved.jpg",newPhoto) Yiğit Arısoy 21727996 import numpy as np import matplotlib.pyplot as plt import random from skimage.io import imread,imsave from skimage import filters,exposure,feature,measure,util from skimage import color img = imread("findit.jpg") imgGamma = exposure.adjust_gamma(img,3) imgInverted = util.invert(img) img_eq = exposure.equalize_hist(imgInverted) imgInvertedGamma = exposure.adjust_gamma(img_eq,5) image_minmax_scaled = exposure.rescale_intensity(imgInvertedGamma,in_range=(0, 255)) plt.subplot(111) plt.imshow(image_minmax_scaled.mean(axis=2),cmap="PuOr") plt.savefig("found.jpg") img = imread("found.png") imgGamma = exposure.adjust_gamma(img,2) plt.subplot(111) plt.imshow(imgGamma.mean(axis=2),cmap="PuOr") plt.show()


