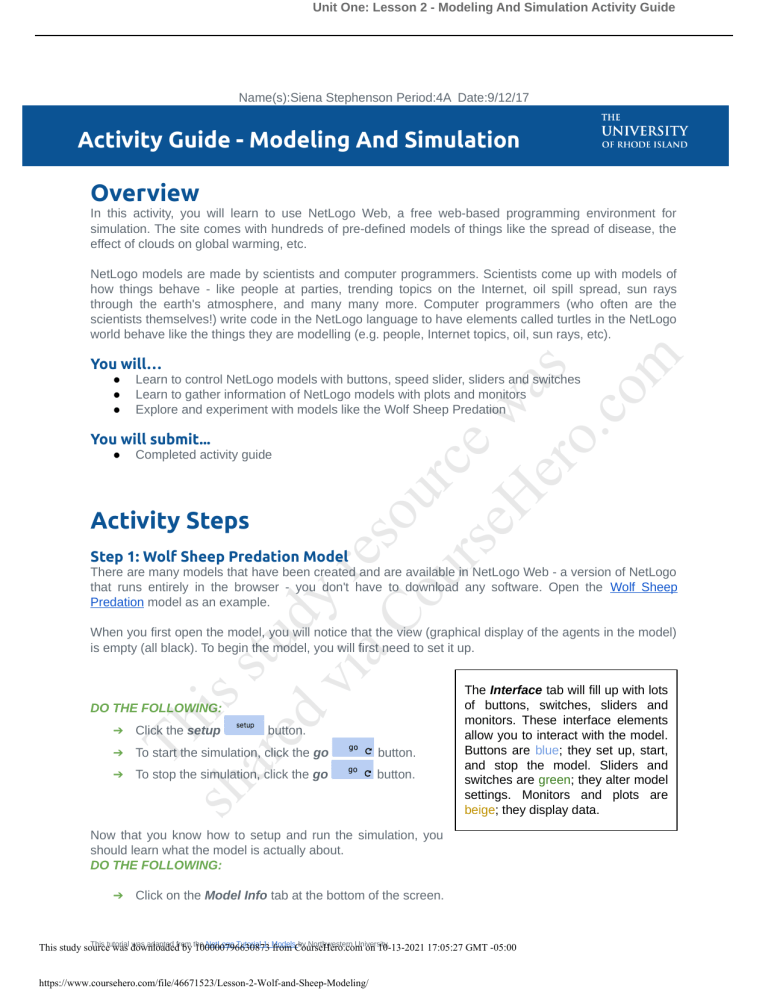
Unit One: Lesson 2 - Modeling And Simulation Activity Guide Name(s):Siena Stephenson Period:4A Date:9/12/17 Activity Guide - Modeling And Simulation Overview In this activity, you will learn to use NetLogo Web, a free web-based programming environment for simulation. The site comes with hundreds of pre-defined models of things like the spread of disease, the effect of clouds on global warming, etc. You will… ● ● ● is ar stu ed d vi y re aC s o ou urc rs e eH w er as o. co m NetLogo models are made by scientists and computer programmers. Scientists come up with models of how things behave - like people at parties, trending topics on the Internet, oil spill spread, sun rays through the earth's atmosphere, and many many more. Computer programmers (who often are the scientists themselves!) write code in the NetLogo language to have elements called turtles in the NetLogo world behave like the things they are modelling (e.g. people, Internet topics, oil, sun rays, etc). Learn to control NetLogo models with buttons, speed slider, sliders and switches Learn to gather information of NetLogo models with plots and monitors Explore and experiment with models like the Wolf Sheep Predation You will submit... ● Completed activity guide Activity Steps Step 1: Wolf Sheep Predation Model There are many models that have been created and are available in NetLogo Web - a version of NetLogo that runs entirely in the browser - you don't have to download any software. Open the Wolf Sheep Predation model as an example. When you first open the model, you will notice that the view (graphical display of the agents in the model) is empty (all black). To begin the model, you will first need to set it up. Th DO THE FOLLOWING: ➔ Click the setup button. button. ➔ To stop the simulation, click the go button. sh ➔ To start the simulation, click the go The Interface tab will fill up with lots of buttons, switches, sliders and monitors. These interface elements allow you to interact with the model. Buttons are blue; they set up, start, and stop the model. Sliders and switches are green; they alter model settings. Monitors and plots are beige; they display data. Now that you know how to setup and run the simulation, you should learn what the model is actually about. DO THE FOLLOWING: ➔ Click on the Model Info tab at the bottom of the screen. This tutorial was adapted from the NetLogo Tutorial 1: Models by Northwestern University. This study source was downloaded by 100000796630873 from CourseHero.com on 10-13-2021 17:05:27 GMT -05:00 https://www.coursehero.com/file/46671523/Lesson-2-Wolf-and-Sheep-Modeling/ Unit One: Lesson 2 - Modeling And Simulation Activity Guide As you can see, this offers guidance and insight into the model, how to run it, and some things to try. Answer the following question in the box below about the Sheep Wolf Predation model. Let’s Write! In your own words, describe what the model is. Hint: Look at Model Info section. This model shows the stability of predator-prey ecosystems.In A system is stable if it tends to maintain itself over time, despite fluctuations in population sizes. Step 2: Controlling The Model With Buttons is ar stu ed d vi y re aC s o ou urc rs e eH w er as o. co m When a button is pressed, the model responds with an action. A button can be a once button, or a forever button. You can tell the difference between these two types of buttons by a symbol on the face of the button. Once buttons don't have Most models, including the Wolf Sheep Predation, have a one the arrows, like this: button called set up and a forever button called go. Many models also have a one button called go once or step once which is like go except that it advances the model by one tick (time step) instead of Once buttons do one action over and over. Using a one button like this lets you watch the and then stop. When the progress of the model more closely. action is finished, the button pops back up. Stopping a forever button is the normal way to pause or stop a model. After pausing, you can make it resume by pressing the button again. (You can also stop a model with the Halt item on the Tools menu, but you should only do this if the model is stuck for some reason. Using Halt may interrupt the model in the middle of an action, and as the result the model could get confused.) DO THE FOLLOWING: ➔ Experiment with setup and go buttons to run the Wolf Sheep Predation model several times. Let’s Write! the Do you ever get different results if you run the model several times with Th same settings? sh When I stopped the simulation at 400 ticks there was 170 sheep, 70 wolves and 221 grass. The second time I tried it with the same settings after 400 ticks I ended up with 193 sheep, 64 wolves and 216 grass. I noticed that the number are close each time. Step 3: Controlling Speed With Speed Slider The speed slider allows you to control the speed of a model, that is, the speed at which turtles move, This tutorial was adapted from the NetLogo Tutorial 1: Models by Northwestern University. This study source was downloaded by 100000796630873 from CourseHero.com on 10-13-2021 17:05:27 GMT -05:00 https://www.coursehero.com/file/46671523/Lesson-2-Wolf-and-Sheep-Modeling/ Foreve arrows corners Forever action o When y to stop, again. I current back up Unit One: Lesson 2 - Modeling And Simulation Activity Guide patches change color, and so on. When you move the slider to the left, the model slows down so there are longer pauses between each tick (time step). That makes it easier to see what is happening. You might even slow the model down so far as to see exactly what a single turtle is doing. When you move the speed slider to the right, the model speeds up. NetLogo will start skipping frames, that is, it won't update the view at the end of every tick, only some ticks. Updating takes time, so fewer view updates means the model progresses faster. is ar stu ed d vi y re aC s o ou urc rs e eH w er as o. co m Note that if you push the speed slider well to the right, the view may update so infrequently that the model appears to have slowed down. It hasn't, as you can see by watching the tick counter race ahead. Only the frequency of view updates has lessened. Step 4: Adjusting Settings With Sliders And Switches A model's settings let you explore different scenarios or hypotheses. Altering the settings and then running the model to see how it reacts can give you a deeper understanding of the phenomena being modeled. sh Th Switches and sliders give you access to a model's settings. Here are the switches and sliders in Wolf Sheep Predation: Let's experiment with their effect on the behavior of the Wolf Sheep Predation model. DO THE FOLLOWING: ➔ Click the setup button. This tutorial was adapted from the NetLogo Tutorial 1: Models by Northwestern University. This study source was downloaded by 100000796630873 from CourseHero.com on 10-13-2021 17:05:27 GMT -05:00 https://www.coursehero.com/file/46671523/Lesson-2-Wolf-and-Sheep-Modeling/ Unit One: Lesson 2 - Modeling And Simulation Activity Guide ➔ Click the go button. ➔ Let the model run about 100 ticks (the tick count is shown above the view). ➔ Click the go Let’s Write! button to stop the model. What happened to the sheep over time? Over time (100 ticks) the sheep definitely doubled in numbers. There was 366 sheep after the 100 ticks was over and only 214 wolves. Now see what happens to the sheep if you change a setting in the Wolf Sheep Predation model. is ar stu ed d vi y re aC s o ou urc rs e eH w er as o. co m DO THE FOLLOWING: ➔ Turn the grass? switch on. ➔ Click the setup button. ➔ Click the go button. ➔ Let the model run about 100 ticks (the tick count is shown above the view). Turning the grass? switch on will affect the outcome of the model. With the switch off, the amount of grass available always stayed the same. This is not a realistic look at the predator-prey relationship; so by setting and turning on a grass regrowth rate, we were able to model all three factors: sheep, wolf and grass populations. DO THE FOLLOWING: ➔ Turn the grass? switch on. ➔ Click the setup button. ➔ Click the go button. ➔ Re-run the simulation for 100 ticks (the tick count is shown above the view). Let’s Write! Was the outcome the same as your previous run of the simulation? Why? sh Th No the outcome was not the same. With the grass switch on there was more sheep eating the grass then more wolves eating the sheep. Overall there was 182 sheep, 66 wolves and 206 grass. This tutorial was adapted from the NetLogo Tutorial 1: Models by Northwestern University. This study source was downloaded by 100000796630873 from CourseHero.com on 10-13-2021 17:05:27 GMT -05:00 https://www.coursehero.com/file/46671523/Lesson-2-Wolf-and-Sheep-Modeling/ Unit One: Lesson 2 - Modeling And Simulation Activity Guide Another type of setting is called a slider. While a switch has only two values, on and off, a slider has a whole range of numeric values. For example, the initial-number-sheep slider has a minimum value of 0 and a maximum value of 250. The model could run with 0 sheep or it could run with 250 sheep, or anywhere in between. Try this out and see what happens. As you move the marker from the minimum to the maximum value, the number on the right side of the slider changes; this is the number the slider is currently set to. Let's see what would happen to the sheep population if there were more sheep and less wolves initially. DO THE FOLLOWING: ➔ Turn the grass? switch off. ➔ Set the initial-number-sheep slider to 100. ➔ Set the initial-number-wolves slider to 20. ➔ Click the setup button. is ar stu ed d vi y re aC s o ou urc rs e eH w er as o. co m ➔ Click the go button. ➔ Let the model run for about 100 ticks. Try running the model several times with these settings. Once you are finished, answer the following the questions. Let’s Write! What happened to the sheep population? Why? After the 100 ticks the sheep population increased into 2214 while the wolf population was 119. I think this happens because the individual sheep population was slid up 100 and the individual wolf population down to 20. Let’s Write! What other switches and sliders can be adjusted to help out the sheep population? Why? Th To help the sheep population you can increase individual-number-sheep and slide that all the way up and or you can increase the sheep's reproduction to help the population of the sheep. sh DO THE FOLLOWING: ➔ Set initial-number-sheep to 80 and initial-number-wolves to 50 (this is close to how they were when you first opened the model). ➔ Set sheep-reproduce to 10.0%. ➔ Click the setup button. ➔ Click the go button. ➔ Let the model run for about 100 time ticks This tutorial was adapted from the NetLogo Tutorial 1: Models by Northwestern University. This study source was downloaded by 100000796630873 from CourseHero.com on 10-13-2021 17:05:27 GMT -05:00 https://www.coursehero.com/file/46671523/Lesson-2-Wolf-and-Sheep-Modeling/ Unit One: Lesson 2 - Modeling And Simulation Activity Guide Let’s Write! What happened to the wolves in this run? Why? A lot of the wove during this run of 100 ticks were dying more than the sheep were dying. I think this happens because the sheep reproduce double the time faster than the wolves reproduce. When you open a model, all the sliders and switches are on a default setting. If you open a new model or exit the program, your changed settings will not be saved. In addition to sliders and switches, some models have choosers and input boxes. The Wolf Sheep Predation doesn't have any of these. is ar stu ed d vi y re aC s o ou urc rs e eH w er as o. co m Step 5: Gathering Information With Plots And Monitors The view lets you see what's going on in a model. NetLogo also provides has other ways of giving you information about model run, such as plots and monitors. Plots The plot in Wolf Sheep Predation model contains three lines: sheep, wolves, and grass / 4. (The grass count is divided by four so it doesn't make the plot too tall.) The lines show what's happening in the model over time. The plot legend shows what each line indicates. In this case, it's the population counts. When a plot gets close to becoming filled up, the horizontal axis is compressed and all of the data from before gets squeezed into a smaller space. In this way, more room is made for the plot to grow. If you want to save the plot, you can download it as an image. The installed version of NetLogo supports exporting data as a CSV file with values of all monitors per time tick; unfortunately, NetLogo Web does not support this. Monitors Th Monitors are another means of displaying information from a model. Here are the monitors in Wolf Sheep Predation model: The monitors show us the population of sheep and wolves, and the amount of grass. (Remember, the amount of grass is divided by four to keep the plot from getting too tall.) sh The numbers displayed in the monitors change as the model runs, whereas the plots show you data from the whole course of the model run. In the run of the simulation with the default values, the sheep population was lower in numbers then the wolf population. We then adjusted the initial number of sheep and wolves favoring the sheep population and still ended up with more wolves than sheep. Keeping the same values from the previous run, we then increased the reproductive rate of the sheep, with the result of all sheep and no wolves. At what settings would you find a balance between the three populations: grass, sheep and wolf? A balance means that all This tutorial was adapted from the NetLogo Tutorial 1: Models by Northwestern University. This study source was downloaded by 100000796630873 from CourseHero.com on 10-13-2021 17:05:27 GMT -05:00 https://www.coursehero.com/file/46671523/Lesson-2-Wolf-and-Sheep-Modeling/ Unit One: Lesson 2 - Modeling And Simulation Activity Guide three populations are in a relatively steady state without growing, or shrinking dramatically and without apparent threat of extinction. Let’s Paste! with a Place a screenshot in the box below showing the settings and the plots is ar stu ed d vi y re aC s o ou urc rs e eH w er as o. co m balance of grass, sheep, and wolf populations. The NetLogo world is a two dimensional grid of patches. Patches are the individual squares in the grid. In Wolf Sheep Predation, when the grass? switch is on the individual patches are easily seen, because some are green, others brown. sh Th Think of the patches as being like square tiles in a room with a tile floor. By default, exactly in the middle of the room is a tile labeled (0,0); meaning that if the room was divided in half one way and then the other way, these two dividing lines would intersect on this tile. We now have a coordinate system that will help us locate objects within the room: Let’s Write! How many How many tiles away is the (0,0) tile from the right side of the room? tiles away is the (0,0) tile from the left side of the room? This tutorial was adapted from the NetLogo Tutorial 1: Models by Northwestern University. This study source was downloaded by 100000796630873 from CourseHero.com on 10-13-2021 17:05:27 GMT -05:00 https://www.coursehero.com/file/46671523/Lesson-2-Wolf-and-Sheep-Modeling/ Unit One: Lesson 2 - Modeling And Simulation Activity Guide The number of tiles from the left side of the room is 3 tiles. The number of tiles on the right side of the room was 3 tiles away. In NetLogo, the number of tiles from right to left is called world-width. And the number of tiles from top to bottom is world-height. These numbers are defined by top, bottom, left and right boundaries. Step 6: Simulations Are Programmed is ar stu ed d vi y re aC s o ou urc rs e eH w er as o. co m At the bottom of the NetLogo Web web page there is a button to expand and show the NetLogo Code. This is the code in the NetLogo programming language that makes the simulation happen. A programmer took the behavior of wolves and sheep and their dependence on their environment (grass) and wrote NetLogo code to make the elements in the simulation behave that way. Once you learn the NetLogo language, you can edit the code and adapt the simulation to do new things, add more the environment, etc. Or, you can think of your own things that you want to simulate and write the NetLogo code for it yourself! DO THE FOLLOWING: ➔ Click on the NetLogo Code tab at the bottom of the screen. ➔ Find where it says to go on a line by itself. This is the code that is run when you click the go Place a screenshot in the box below showing the code for to go. sh Th Let’s Paste! button. This tutorial was adapted from the NetLogo Tutorial 1: Models by Northwestern University. This study source was downloaded by 100000796630873 from CourseHero.com on 10-13-2021 17:05:27 GMT -05:00 https://www.coursehero.com/file/46671523/Lesson-2-Wolf-and-Sheep-Modeling/ Unit One: Lesson 2 - Modeling And Simulation Activity Guide Step 7: Other Models Once you are done exploring the Wolf Sheep Predation model, you may want to take some time just to explore some of the other models available in the Models Library in the drop down at the top of the NetLogo Web web page. DO THE FOLLOWING: ➔ Go through the model library and pick a model that is not the Wolf and Sheep Predation or the Party simulation. ➔ Open it. ➔ Read the Model Info tab at the bottom of the screen. In a few sentences explain what the model simulates and what you is ar stu ed d vi y re aC s o ou urc rs e eH w er as o. co m Let’s Write! might do with it. I think the sunflower simulation is The spirals found in the seeds, petals and branches of many plants occur naturally through the growth of the flower. Place a screenshot in the box below showing the model running for 100 sh Th Let’s Paste! ticks. This tutorial was adapted from the NetLogo Tutorial 1: Models by Northwestern University. This study source was downloaded by 100000796630873 from CourseHero.com on 10-13-2021 17:05:27 GMT -05:00 https://www.coursehero.com/file/46671523/Lesson-2-Wolf-and-Sheep-Modeling/ Powered by TCPDF (www.tcpdf.org)


