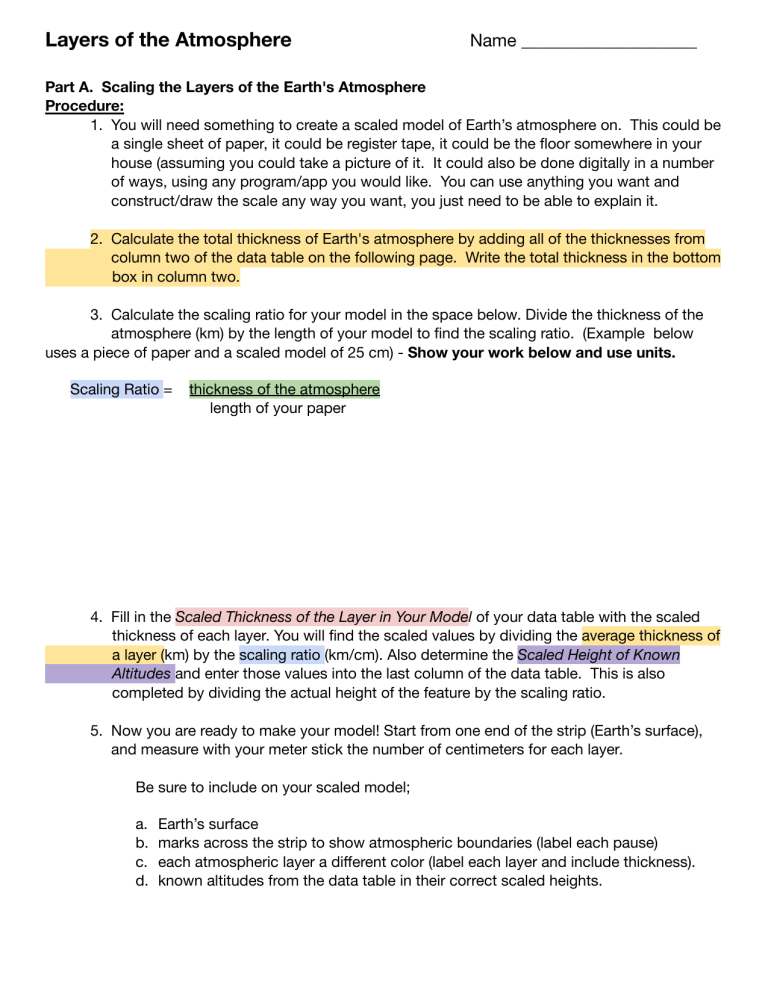
Layers of the Atmosphere Name ____________________ Part A. Scaling the Layers of the Earth's Atmosphere Procedure: 1. You will need something to create a scaled model of Earth’s atmosphere on. This could be a single sheet of paper, it could be register tape, it could be the floor somewhere in your house (assuming you could take a picture of it. It could also be done digitally in a number of ways, using any program/app you would like. You can use anything you want and construct/draw the scale any way you want, you just need to be able to explain it. 2. Calculate the total thickness of Earth's atmosphere by adding all of the thicknesses from column two of the data table on the following page. Write the total thickness in the bottom box in column two. 3. Calculate the scaling ratio for your model in the space below. Divide the thickness of the atmosphere (km) by the length of your model to find the scaling ratio. (Example below uses a piece of paper and a scaled model of 25 cm) - Show your work below and use units. Scaling Ratio = thickness of the atmosphere length of your paper 4. Fill in the Scaled Thickness of the Layer in Your Model of your data table with the scaled thickness of each layer. You will find the scaled values by dividing the average thickness of a layer (km) by the scaling ratio (km/cm). Also determine the Scaled Height of Known Altitudes and enter those values into the last column of the data table. This is also completed by dividing the actual height of the feature by the scaling ratio. 5. Now you are ready to make your model! Start from one end of the strip (Earth’s surface), and measure with your meter stick the number of centimeters for each layer. Be sure to include on your scaled model; a. b. c. d. Earth’s surface marks across the strip to show atmospheric boundaries (label each pause) each atmospheric layer a different color (label each layer and include thickness). known altitudes from the data table in their correct scaled heights. Data Table for Scaling the Layers of the Atmosphere Name of Layer Average Thickness of Layer (km) Troposphere 12 Stratosphere 40 Scaled Thickness of the Layer in Your Model (cm) Known Altitudes Scaled Height of Known Altitudes Above Earth’s Surface on Your Model (cm) Mt Everest - 8.8 km Highest point in NY-(Mt. Marcy) 1.6 km High Rocky Mountain peaks – 4.2 km Tropopause - 12 km 747 cruising height- 13 km Highest cloud tops –cumulonimbus – 18 km Ozone layer – 25 km Stratopause – 52 km Mesosphere 30 Mesopause- 82 km Thermosphere 518 Total Thickness of the Atmosphere _______ Orbit of International Space Station – 340 km Questions: 1. What part of the atmosphere do humans spend the vast majority of their life in? 2. If you were to measure the atmosphere directly above Mohonasen High School, what percentage of the atmosphere (by distance) does the troposphere take up? Assume the Earth’s surface is 0 km, the troposphere ends at 12 km, and the atmosphere ends at 600 km above the Earth’s surface? Show your work! Part B. Temperature of Earth’s Atmosphere Procedure: Table 1 below contains temperature readings at various altitudes in the Earth’s atmosphere. 1. Plot this data on the graph provided on the next page. Be sure to Label all parts of the graph and create an appropriate set of axes. 2. Connect the points with a solid line. Think about how the points on this line should be connected. (This profile provides a general picture of the conditions in the atmosphere at any given time, however actual temperature values may deviate) 3. Label the different layers of the atmosphere and the separating boundaries between each layer. Use information from Part A to determine exactly where the boundaries are (pauses indicate atmospheric boundary layers) Table 1 Average Temperature Readings at various altitudes ALTITUDE (km) TEMPERATURE (° C) 0 5 10 12 20 25 30 35 40 45 48 52 55 60 65 70 75 80 84 90 95 100 105 110 115 120 15 -18 -49 -55 -55 -51 -46 -37 -22 -8 0 -7 -9 -17 -33 -54 -65 -90 -90 -60 -35 10 37 62 94 111 Questions: 1. Based on the scaled model you created in Part A and your graph of atmospheric temperature created in Part B, what do you believe is the basis for determining the different atmospheric layers? Be specific. 2. Take a look at the Selected Properties of Earth’s Atmosphere chart in your ESRT (page 14). Does this support or refute your claim to how the atmosphere is divided? Explain. 3. a. Based on Selected Properties of Earth’s Atmosphere on page 14 of the ESRT, what other atmospheric variables are not used to determine the divisions of atmospheric layers? b. Also based on the graph, why would you say these variables are not used to determine different atmospheric layers ? 4. Why does your model of the layers of Earth’s atmosphere (from Part A) look so different from the graph above and the graph on Selected Properties of Earth’s Atmosphere in your ESRT? Part C. Selected Properties of Earth’s Atmosphere Use Selected Properties of Earth’s Atmosphere (ESRT page 14) to answer the following questions. 4. List the atmospheric layers in order of increasing altitude. 5. What happens to the temperature of the atmosphere as you travel up through the troposphere? stratosphere? mesosphere? thermosphere? 6. What temperature zone is the thickest layer? thinnest layer? 7. What is the altitude of the tropopause in km? in mi? stratopause in km? in mi? mesopaus in km? in mi? 8. Describe how the atmospheric pressure changes with altitude. 9. What is the pressure of the atmosphere at sea level in atm? What is the pressure at sea level in in of Mg? How did you find this answer? – explain. 10. Describe how the concentration of water vapor changes as altitude increases. 11. What is the concentration of water vapor above the troposphere? 12. Think about what you have learned about the atmosphere and what you already know about weather. Why is it that all of the weather occurs in the troposphere (with the exception of extremely large thunderstorms)?
