toaz.info-mid-exam-statistic-pr 271fa3e12a0d19766c7f3bd96da04bc8
advertisement

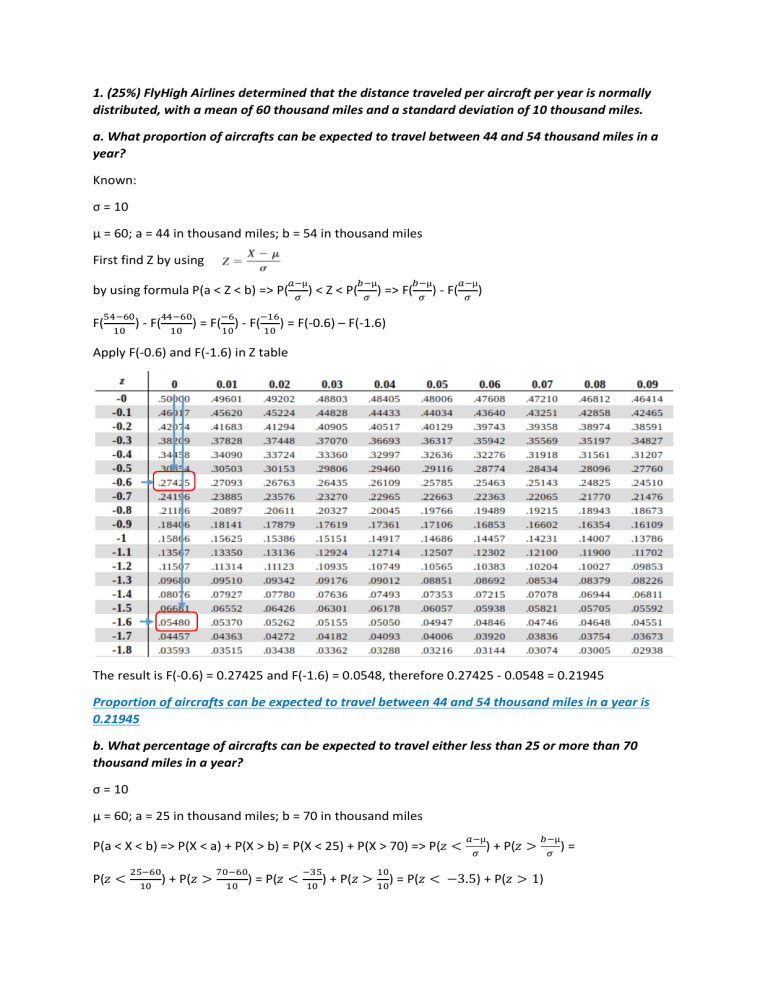
1. (25%) FlyHigh Airlines determined that the distance traveled per aircraft per year is normally distributed, with a mean of 60 thousand miles and a standard deviation of 10 thousand miles. a. What proportion of aircrafts can be expected to travel between 44 and 54 thousand miles in a year? Known: σ = 10 µ = 60; a = 44 in thousand miles; b = 54 in thousand miles First find Z by using 𝑎−µ ) 𝜎 by using formula P(a < Z < b) => P( F( 54−60 ) 10 44−60 ) 10 - F( −6 𝑏−µ ) 𝜎 < Z < P( 𝑏−µ ) 𝜎 => F( - F( 𝑎−µ ) 𝜎 −16 = F( 10 ) - F( 10 ) = F(-0.6) – F(-1.6) Apply F(-0.6) and F(-1.6) in Z table The result is F(-0.6) = 0.27425 and F(-1.6) = 0.0548, therefore 0.27425 - 0.0548 = 0.21945 Proportion of aircrafts can be expected to travel between 44 and 54 thousand miles in a year is 0.21945 b. What percentage of aircrafts can be expected to travel either less than 25 or more than 70 thousand miles in a year? σ = 10 µ = 60; a = 25 in thousand miles; b = 70 in thousand miles P(a < X < b) => P(X < a) + P(X > b) = P(X < 25) + P(X > 70) => P(𝑧 < P(𝑧 < 25−60 ) 10 + P(𝑧 > 70−60 ) 10 = P(𝑧 < −35 ) 10 10 𝑎−µ ) 𝜎 + P(𝑧 > 𝑏−µ ) 𝜎 + P(𝑧 > 10) = P(𝑧 < −3.5) + P(𝑧 > 1) = Apply P(-3.5) and P(1) in Z table The result is P(-3.5) = 0.0002 and P(1) = 0.84134, since the percentage of aircrafts can be expected to travel more than 70 thousand miles in a year (end tail), so P(1) > 0.84134 = 1 - 0.84134 = 0.15866. Back to formula P(X < 25) + P(X > 70) = P(𝑧 < −3.5) + P(𝑧 > 1) = P(-3.5) + (1-P(1)) = 0.0002 + (1 0.84134) = 0.0002 + 0.15866 = 0.15889 or 15.889% Percentage of aircrafts can be expected to travel either less than 25 or more than 70 thousand miles in a year = 15.889% c. How many miles will be traveled by at least 70 percent of the aircrafts? Since “at least” is more than 70%, or 30% from the lower tail of curve 70% 30% P(X > Z) = 0.3, apply to Z-table, the closest value of 0.3000 is -0.52 therefore Z value is -0.52 Next, find X by using X = 60 + (-0.52)*10 = 60 + (-5.2) = 54.8 Miles will be traveled by at least 70 percent of the aircrafts is 54.8 in thousand miles. d. What are your answers to (a) through (c) if the standard deviation is 12 thousand miles? d.a) What proportion of aircrafts can be expected to travel between 44 and 54 thousand miles in a year? Known: σ = 12 µ = 60; a = 44 in thousand miles; b = 54 in thousand miles First find Z by using by using formula P(a < Z < b) => P( F( 54−60 ) 12 44−60 ) 12 - F( −6 𝑎−µ ) 𝜎 𝑏−µ ) 𝜎 < Z < P( 𝑏−µ ) 𝜎 => F( - F( 𝑎−µ ) 𝜎 −16 = F( 12 ) - F( 12 ) = F(-0.5) – F(-1.33) Apply F(-0.5) and F(-1.33) in Z table The result is F(-0.5) = 0.30854 and F(-1.6) = 0.09176, therefore 0.30854 - 0.09176 = 0.21408 Proportion of aircrafts can be expected to travel between 44 and 54 thousand miles in a year is 0.21408 d.b) What percentage of aircrafts can be expected to travel either less than 25 or more than 70 thousand miles in a year? σ = 12 µ = 60; a = 25 in thousand miles; b = 70 in thousand miles P(a < X < b) => P(X < a) + P(X > b) = P(X < 25) + P(X > 70) => P(𝑧 < P(𝑧 < 25−60 ) 12 + P(𝑧 > 70−60 ) 12 = P(𝑧 < −35 ) 12 𝑎−µ ) 𝜎 + P(𝑧 > 𝑏−µ ) 𝜎 = 10 + P(𝑧 > 12) = P(𝑧 < −2.92) + P(𝑧 > 0.83) Apply P(-2.92) and P(0.83) in Z table The result is P(-2.92) = 0.0018 and P(0.83) = 0.79673, since the percentage of aircrafts can be expected to travel more than 70 thousand miles in a year (end tail), so P(1) > 0.79673 = 1 - 0.79673 = 0.20327. Back to formula P(X < 25) + P(X > 70) = P(𝑧 < −2.92) + P(𝑧 > 0.83) = P(-2.92) + (1-P(0.83)) = 0.0002 + (1 - 0.79673) = 0.0018 + 0.20327 = 0.20507 or 20.507% Percentage of aircrafts can be expected to travel either less than 25 or more than 70 thousand miles in a year = 20.507% d.c) How many miles will be traveled by at least 70 percent of the aircrafts? Since “at least” is more than 70%, or 30% from the lower tail of curve 70% 30% P(X > Z) = 0.3, apply to Z-table, the closest value of 0.3000 is -0.52 therefore Z value is -0.52 Next, find X by using X = 60 + (-0.52)*12 = 60 + (-6.24) = 53.76 Miles will be traveled by at least 70 percent of the aircrafts is 53.76 in thousand miles. 2. (25%) You plan to conduct a marketing experiment in which students will be asked to taste one of two different brands of soft drink. Their task is to correctly identify the brand tasted. You select a random sample of 190 students and assume that the students have no ability to distinguish between the two brands (which means that the two brands are equally likely to be picked.) a. What is the probability that between 50% and 60% of the identifications will be correct in the sample? Known: n = 190 population proportion (π) = 0.5 Find standard error of proportion 0.5∗(1−0.5) 190 √ 0.5∗(0.5) 190 =√ 0.25 = 190 =√ √0.00132 = 0.0363 So σp = 0.0363 First find Z by using by using formula P(a < Z < b) => P( 0.6−0.5 0.5−0.5 0.1 𝑎−µ ) 𝜎 𝑏−µ ) 𝜎 < Z < P( 𝑏−µ ) 𝜎 => P( 𝑎−µ ) 𝜎 - P( 0 P( 0.0363 ) - P( 0.0363 ) = P(0.0363) - P(0.0363) = P(2.755) – P(0) Apply P(2.755) and P(0) in Z table The result is P(2.755) = 0.99711 and P(0) = 0.5, therefore 0.99711 - 0.5 = 0.49711 The probability that between 50% and 60% of the identifications will be correct in the sample is 0.49711 b. What are the symmetrical limits of the population percentage within which the sample percentage is contained with a probability of 90%? The probability is 90% that the sample percentage is contained between a and b: P(a < 𝑝̂ < b) = 0.90 P( -z < Z < z) = 0.90 P(Z < -z) – P(Z > z) = 1 -0.90 2P(Z < -z) = 0.10 P(Z < -z) = 0.05 z = ± 1.645 By using formula Subtitution: X=π µ = p = 0.5 σ = σp = 0.0363 z= π−𝑝 𝜎𝑝 = z* σp = π − 𝑝 => π = z* σp + 𝑝 When π = a, and z = -1.645 = -1.645*0.0363 + 0.5 = -0.0597 + 0.5 = 0.4403 = 44.03% ≈ 44% When π = b, and z = 1.645 = 1.645*0.0363 + 0.5 = 0.0597 + 0.5 = 0.5597 = 55.97% ≈ 56% Therefore, the lower limit is 44% and the upper limit is 56%. The sample percentage will be contained within 6% symmetrically around the population percentage 50%. c. What is the probability that the sample percentage of correct identifications is greater than 65%? The probability that the sample percentage of correct identifications is greater than 65%: P(π > 0.65) = (z > 0.65−0.5 )= 0.0363 0.15 (z > 00363) = (z > 4.13), apply to z table z = 0.0001 The probability that the sample percentage of correct identifications is greater than 65% is 0.0001 d. Which is more likely to occur: more than 58% correct identifications in the sample of 190 or more than 54% correct identifications in a sample of 1,000? Explain. Case 1: n = 190 population proportion (π) = 0.5 Find standard error of proportion 0.5∗(1−0.5) 190 √ 0.5∗(0.5) 190 =√ 0.25 = √ 190 = √0.00132 = 0.0363 So σp = 0.0363 The probability that the sample percentage of correct identifications is greater than 58%: P(π > 0.58) = (z > Z = 0.0139 0.58−0.5 )= 0.0363 0.08 (z > 00363) = (z > 2.2), apply to z table Case 2: n = 1000 population proportion (π) = 0.5 Find standard error of proportion 0.5∗(1−0.5) 1000 √ 0.5∗(0.5) 1000 =√ 0.25 = √1000 = √0.00025 = 0.0158 So σp = 0.0158 The probability that the sample percentage of correct identifications is greater than 54%: P(π > 0.54) = (z > 0.54−0.5 )= 0.0158 0.04 (z > 0.0158) = (z > 2.53), apply to z table Z = 0.0057 Since Z for more than 58% correct identifications in the sample of 190 bigger than (>) Z for more than 54% correct identifications in a sample of 1,000, therefore which is more likely to occur - more than 58% correct identifications in the sample of 190 3. (25%) A study reports that the cost of repairing a hybrid vehicle is falling even while typical repairs on conventional vehicles are getting more expensive. One of the most common hybrid repairs, replacing the hybrid inverter assembly, had a mean repair cost of $1,357 in 2014. Suppose a sample of 100 hybrid inverter assembly repairs completed in the last month was selected. The sample mean repair cost was $1,280 with the sample standard deviation of $300. a. Using the critical value approach, at the 0.05 level of significance, is there evidence that the population mean repair cost is less than $1,357? First, define the null hypothesis and alternative hypothesis H0: µ ≥ $1,357 HA: µ < $1,357 Data provided: N = 100 𝑋̅ = $1,280 S = $300 µ = $1,357 α= 0.05 Determine degree of freedom (df) by using formula N – 1 => 100 – 1 = 99. This uses one tailed test alternative hypothesis (lower tailed test) since HA contain “<” sign α = 0.05 = 5%, since one tailed test, we use 5% = 0.05 By using t table, with df = 99 and α = 0.05, the critical value = 1.6604 Since this is lower tailed test, so the result of critical value become negative, therefore the result is -1.6604 Area of rejection Area of nonrejection -1.6604 Therefore test criteria is H0 rejected if Tstat< -1.6604 We need to use T test since σ unknown by formula => 1280−1357 300 √100 = −77 300 10 = −77 30 = -2.567 Comparing test criteria to critical value, Tstat = -2.567 and critical value = -1.6604 so -2.567 < -1.6604, it seems Tstat result fall in rejection region. Decision is Reject H0; Interpretation: there is significant evidence that the population mean repair cost is less than $1,357. b. Perform the same test as (a) using the p-value approach. First, define the null hypothesis and alternative hypothesis H0: µ ≥ $1,357 HA: µ < $1,357 ρ-value ≤ α; H0 is rejected ρ-value > α H0 is not rejected Data provided: N = 100 𝑋̅ = $1,280 S = $300 µ = $1,357 α= 0.05 We need to use T test since σ unknown by formula => 1280−1357 300 √100 = −77 300 10 = −77 30 = -2.567 Tstat = -2.567 Find probability of Tstat by using t-score table for -2.567 ≈ -2.57 probability of Tstat by using z-score table for -2.567 ≈ -2.57 is 0.0051 So ρ-value is 0.0051 Decision: ρ-value = 0.0051 and α= 0.05 0.0051 < 0.05 therefore ρ-value < α; Decision is Reject H0; Interpretation: there is significant evidence that the population mean repair cost is less than $1,357. 4. (25%) A recent study found that 61 children who watched a commercial for potato chips featuring a long-standing sports celebrity endorser ate a mean of 38 grams of potato chips as compared to a mean of 26 grams for another group of 51 children who watched a commercial for an alternative food snack. Suppose that the sample standard deviation for the children who watched the sports celebrity–endorsed potato chips commercial was 21.5 grams and the sample standard deviation for the children who watched the alternative food snack commercial was 12.9 grams. a. Assuming that the population variances are equal and = 0.05, is there evidence that the mean amount of potato chips eaten was significantly higher for the children who watched the sports celebrity–endorsed potato chips commercial? First, define the null hypothesis and alternative hypothesis H0: µ1 = µ2 or µ1 - µ2 = 0 HA: µ1 ≠ µ2 Find degree of freedom by using formula: (n1 - 1)+(n2 - 1) = (61 - 1)+(51 - 1) = 60 + 50 = 110 So df is equal to 110 α = 0.05 level of significance, formula used is α/2; therefore 0.025 Find the critical value by using formula in Excel = TINV(α;df) = TINV(0.05;110) equal to 1.982 So the critical value for two tailed test are 1.982 and -1.982 Area of rejection Area of rejection Area of nonrejection 1.982 -1.982 Decision rule is: Reject H0 if TSTAT > 1.982 or if TSTAT < -1.982; otherwise, do not reject H0. 𝑋̅ S n childern who watched a commercial for potato chips featuring a longstanding sports celebrity endorser children who watched a commercial for an alternative food snack 38 21.5 61 26 12.9 51 Find Tstat by using formula as follow: ̅̅̅ 𝑋1 = 38 𝑆1 = 21.5 𝑛1 = 61 ̅̅̅ 𝑋2 = 26 𝑆2 = 12.9 𝑛2 = 51 The difference µ1 - µ2 comes from the null hypothesis. In this type of test, we assume no difference in the population means, so we can substitute 0 for µ1 - µ2 Find 𝑆𝑝2 first = (61−1)∗21.52 +(51−1)∗12.92 (61−1)+(51−1) = 60∗462.25+50∗166.41 60+50 = 27735+8320.5 110 = 36055.5 110 = 327.777 Next is to find Tstat: (38−26)−0 12 1 1 = √327.777(61+51) √327.777(0.0164+0.0196) 12 3.435 = 12 √327.777(0.0164+0.0196) = 12 √327.777∗0.036 = 12 √11.8 = 3.493 The result of Tstat is 3.493 Comparing to test criteria is Tstat > 1.982, it seems Tstat result fall in rejection region (3.493 > 1.982) The decision is H0 is rejected. Interpretation: there is evidence that the mean amount of potato chips eaten was significantly higher for the children who watched the sports celebrity–endorsed potato chips commercial. b. Assuming that the population variances are equal, construct a 95% confidence interval estimate of the difference between the mean amount of potato chips eaten by children who watched the sports celebrity–endorsed potato chips commercial and children who watched the alternative food snack commercial. Known: ̅̅̅ 𝑋1 = 38 𝑆1 = 21.5 𝑛1 = 61 ̅̅̅ 𝑋2 = 26 𝑆2 = 12.9 𝑛2 = 51 𝑆𝑝2 = (61−1)∗21.52 +(51−1)∗12.92 (61−1)+(51−1) = 60∗462.25+50∗166.41 60+50 Find degree of freedom by using formula: (n1 - 1)+(n2 - 1) = (61 - 1)+(51 - 1) = 60 + 50 = 110 So df is equal to 110 α = 0.05 level of significance = 27735+8320.5 110 = 36055.5 110 = 327.777 Find the critical value by using formula in Excel = TINV(α;df) = TINV(0.05;110) equal to 1.982 T α/2 = 1.982 In order to find Confident Interval or CI, use the formula below: 1 1 (38 – 26) ± 1.982√327.777(61 + 51) = 12 ± 1.982√327.777(0.0164 + 0.0196) = 12 ± √11.8 = 12 ± 3.435 => 8.565 ≤ µ1 - µ2 ≤ 15.435 Interpretation: Children who watched the sports celebrity–endorsed potato chips commercial has mean amount of between 8.565 and 15.435 grams more potato chips eaten than children who watched the alternative food snack commercial.


