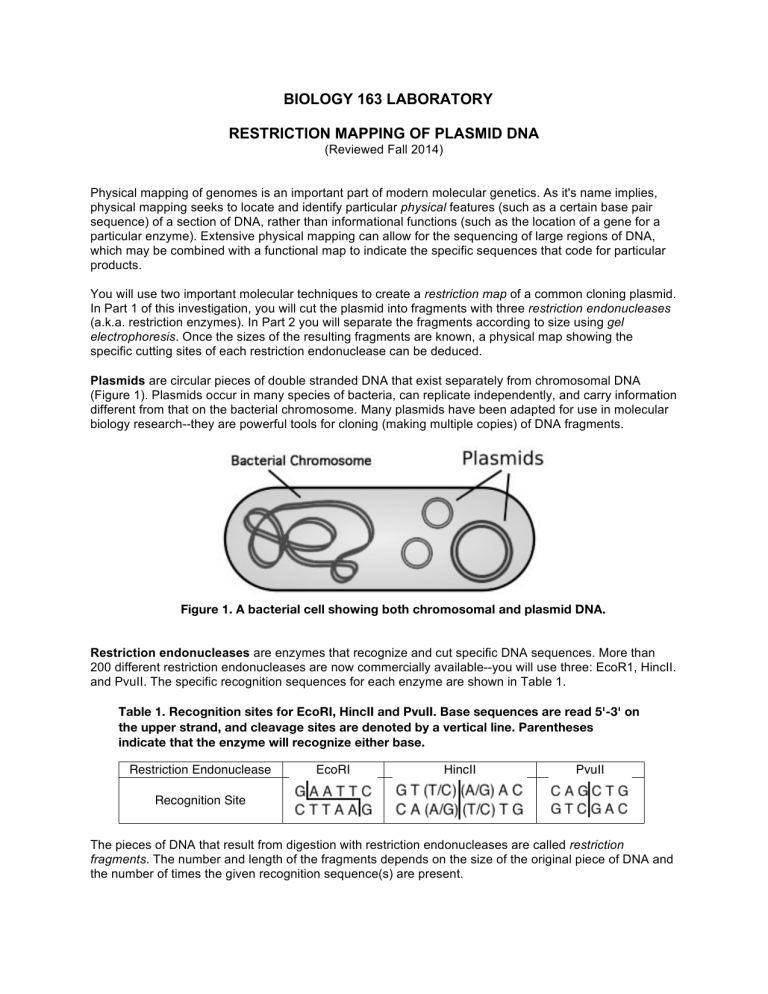
BIOLOGY 163 LABORATORY RESTRICTION MAPPING OF PLASMID DNA (Reviewed Fall 2014) Physical mapping of genomes is an important part of modern molecular genetics. As it's name implies, physical mapping seeks to locate and identify particular physical features (such as a certain base pair sequence) of a section of DNA, rather than informational functions (such as the location of a gene for a particular enzyme). Extensive physical mapping can allow for the sequencing of large regions of DNA, which may be combined with a functional map to indicate the specific sequences that code for particular products. You will use two important molecular techniques to create a restriction map of a common cloning plasmid. In Part 1 of this investigation, you will cut the plasmid into fragments with three restriction endonucleases (a.k.a. restriction enzymes). In Part 2 you will separate the fragments according to size using gel electrophoresis. Once the sizes of the resulting fragments are known, a physical map showing the specific cutting sites of each restriction endonuclease can be deduced. Plasmids are circular pieces of double stranded DNA that exist separately from chromosomal DNA (Figure 1). Plasmids occur in many species of bacteria, can replicate independently, and carry information different from that on the bacterial chromosome. Many plasmids have been adapted for use in molecular biology research--they are powerful tools for cloning (making multiple copies) of DNA fragments. Figure 1. A bacterial cell showing both chromosomal and plasmid DNA. Restriction endonucleases are enzymes that recognize and cut specific DNA sequences. More than 200 different restriction endonucleases are now commercially available--you will use three: EcoR1, HincII. and PvuII. The specific recognition sequences for each enzyme are shown in Table 1. Table 1. Recognition sites for EcoRI, HincII and PvuII. Base sequences are read 5'-3' on the upper strand, and cleavage sites are denoted by a vertical line. Parentheses indicate that the enzyme will recognize either base. Restriction Endonuclease EcoRI HincII PvuII Recognition Site The pieces of DNA that result from digestion with restriction endonucleases are called restriction fragments. The number and length of the fragments depends on the size of the original piece of DNA and the number of times the given recognition sequence(s) are present. Plasmid Restriction Mapping Gel electrophoresis is used to separate restriction fragments according to size. Fragments are loaded into an agarose gel, and an electric field is applied across the gel. Because the DNA fragments are negatively charged, the electric field forces them to move through the pores in the gel. A typical electrophoresis unit is shown in Figure 2. POWER SUPPLY SAMPLE WELLS ANODE (red) CATHODE (black) AGAROSE GEL MIGRATION BUFFER ELECTROPHORESIS CHAMBER ! (Side View) ELECTROPHORESIS CHAMBER ! (Top View) Figure 2. Components of a horizontal electrophoresis system Smaller (shorter) fragments are able to move more easily through the gel than larger (longer) fragments, and therefore move further along the gel in a given period of time. Once electrophoresis is complete, different-sized fragments will appear as distinct bands on the gel (Figure 3). The sizes of those fragments can be estimated by comparing them to a reference sample (or DNA “ladder”) having fragments of known sizes. By comparing the fragments (bands) resulting from single and double digests with different restriction endonucleases, a restriction map of your original DNA segment can be created (Figure 4). Figure 3. A gel after electrophoresis. A 1kb DNA ladder is shown in the left lane. Figure 4. A plasmid restriction map showing the location of each cleavage site. 2 DNA Digestion and Electrophoresis PROCEDURE PART 1: RESTRICTION ENDONUCLEASE DIGESTION OF PLASMID DNA IMPORTANT NOTE: You will need to use different sized pipettes and tips during this exercise--be certain to choose a pipette and tip appropriate for the volume you are transferring! When you draw up a reagent, always check the tip to make sure it is filled! When you dispense a reagent, always check the tip to make sure it is empty! 1. Using a permanent marker, label eight microcentrifuge tubes with your initials and with the label shown in the first column in Table 2. The restriction enzyme digests will be performed in these tubes. One tube will be a control with no enzymes. 2. Use the matrix in Table 2 to add reagents to the tubes. Begin by adding 3µl of plasmid DNA to each tube. 3. Using a new tip, add 2µl of 10X buffer to a clean spot in each reaction tube. Do not touch the DNA already in the tube--if you do, change the tip. 4. Using a new tip, add the indicated amount of distilled water to each tube. Again, to avoid contamination, change tips if it touches any of the solutions already in the tube. 5. Using new tips every time, add 1µl of the appropriate restriction enzyme(s) to each tube. Always draw up enzyme with a new tip! (Tips are inexpensive, restriction enzymes are not!). In this case you may find it helpful to dispense the enzyme directly into the solution already in the tube. 6. After all the reagents have been added, close the tubes, mix by flicking the bottom of the tube, and then spin the reagents down to the bottom of the tube (just a few seconds is sufficient), using the small countertop microcentrifuge. 7. Incubate all tubes at 37°C for a minimum of one hour. 8. Remove the samples and freeze them until you are ready to proceed to Part 2. Table 2. Amounts of reagents to use for 20µl restriction enzyme digestions. Tube E H P EH EP HP EHP Control 0.1 ug/ul plasmid (µl) 3 3 3 3 3 3 3 3 10X Buffer (µl) 2 2 2 2 2 2 2 2 Eco RI (µl) 1 1 1 1 - Hinc II (µl) 1 1 1 1 - Pvu II (µl) 1 1 1 1 - dH2O (µl) 14 14 14 13 13 13 12 15 3 DNA Digestion and Electrophoresis PART 2: GEL ELECTROPHORESIS OF PLASMID DNA RESTRICTION FRAGMENTS 1. Prepare 1% agarose gels as described in Appendix A. 2. While your gel is solidifying, add 4µl of gel loading dye to each tube. Use a new tip for each addition and be sure the solutions are mixed (either by centrifugation of by pipetting the solution in and out a few times). The dye contains bromphenol blue to help track electrophoresis, and sucrose to provide density to facilitate sample loading. 3. Following the order shown in Table 3, load 10µl of each sample* into the wells of your gel. Carefully direct the tip of a micropipette containing the sample through the buffer layer and into the sample well. Be careful not to puncture the bottom of the wells. Slowly eject the sample. (You may find a carefully positioned desk lamp helps in visualizing the submerged wells.) * Except for the ready-to-run ladder. To avoid excessively heavy banding, load only 5µl in well 5. Table 3. Order of sample loading for a 10-well gel. Note that a 1kb ladder is run in lane five as a size reference. (A ready-to-run sample of the ladder will be provided.) Well Sample 1 Control 2 E 3 H 4 P 5* Ladder 6 EH 7 EP 8 HP 9 EHP 10 (Extra) 4. Following the instructions in Appendix B, electrophorese your samples at ~93V for ~1hr. *** While your gels are running, complete the two practice exercises on page 5. *** 5. To visualize the DNA bands on the gel, carefully take your gel (in its gel casting tray) to the UV light box. (Wear gloves!) Pull your sleeves down (or wear a lab coat) and ensure that the UV shield is in place. Turn the UV light box on and the DNA bands will fluoresce green. As directed by your instructor, take a picture or print an image of your gel. 6. Dispose of gels as directed, clean your labware, and leave all items as you found them! *** Use the information on your gels to construct a restriction map of your plasmid. Tips to guide your analysis are found on page 6. *** 4 DNA Digestion and Electrophoresis RESTRICTION MAPPING EXERCISES Practice Problem 1 A restriction map for a fictitious 4000 base pair plasmid is shown in Figure 5. Create a figure predicting the appearance of a gel showing digests with EcoRI, BamHI, and EcoRI and BamHI combined. Your figure should include a lane showing a 1kb ladder for reference. (A photo of a 1kb ladder is provided in the lab for your reference.) Figure 5. A restriction map of a plasmid showing cut sites for EcoRI and BamHI. Practice Problem 2 An unknown plasmid is digested with EcoRI and HindIII, and the fragments are separated by gel electrophoresis. A diagram of the resulting gel is shown in Figure 6. Use this information to create a restriction map of the plasmid. Figure 6. Results of gel electrophoresis of a plasmid digested with EcoRI and HindIII. 5 DNA Digestion and Electrophoresis Tips for Constructing a Plasmid Restriction Map There are several approaches to creating a restriction map. Some people may be able to assemble a simple map intuitively, while others will need to employ a more systematic approach. You will likely devise a strategy that makes sense to you. The following tips, if needed, can help to guide your analysis. NOTE: A circular (uncut) plasmid typically exists in a "supercoiled" form that behaves like a fragment smaller than a linear piece of DNA of the same size. The bright band in your "control" sample demonstrates this--because the plasmid travels further along the gel in its supercoiled form, size comparisons to the DNA ladder are not accurate! The control sample is simply used to detect the presence of undigested DNA that may remain in your digested samples--it does not otherwise factor into your analysis! • • • • • • • • • • Keep in mind that although the fragments represented on your gel are linear, a plasmid is a circular piece of DNA. Use a petri dish (or other similar object) to draw neat circles that will serve as a template for your map. You will probably need to draw many such circles as you develop your analysis. Determine the approximate total length (base pairs) of your plasmid. (How can you do this?) Use this number to draw a scale on your map. Start your numbering at 12:00 and continue in a clockwise direction (Figure 7). Start by creating a map from one of your single digests. Place a cut at 12:00. If there is more than one cut (i.e., if more than one fragment is generated) position the additional cuts on your map based on the approximate lengths of the resulting fragments. You may find it helpful to repeat the above step for each of your single digests. Use the information from your double digests to superimpose your single digests on top of each other. For simplicity, choose a "reference cut" to remain at 12:00 rotate the other cuts relative to this one. (If you have trouble visualizing this, you may want to make actual plasmid models using paper cutouts or stiff wire with tape tags to show the cut sites.) Be sure to check all resulting fragment sizes against the sizes of the fragments shown on the gel. When comparing double digests to single digests, take note of which fragments from the single digest are conserved, and which are cut into smaller fragments. This will allow you to properly position the cuts from the second enzyme. Be aware that size estimates are more accurate when analyzing SMALLER fragments. Keep this in mind if you encounter “contradictory” information on your gel! If applicable, use your triple digest to confirm the sizes of all fragments on your final map. As a final step, double-check all your calculations. Everything needs to add up properly and consistently! If necessary, adjust your fragment size estimates to rectify any errors. Your final map should be presented as a neatly constructed figure clearly showing the total length of the plasmid, the relative locations of the cut sites of all restriction endonucleases used, the approximate location (base pair) of each cut, and the approximate length of each fragment. Figure 7. A sample template for a 3200bp plasmid. 6 DNA Digestion and Electrophoresis APPENDIX A: Preparing the Agarose Gel 1. With a pipette or graduated cylinder, dispense 30ml of electrophoresis buffer (TAE Buffer) into a 50 ml Erlenmeyer flask and add 0.30g of agarose. Mix by swirling. 2. Place the flask into a microwave oven and heat until the agarose is dissolved. (Follow the instructions posted on the oven!) When the agarose solution is absolutely clear, remove the flask from the oven. 3. Put on gloves. Add 3.0µl of GelStar* to your dissolved agarose solution and swirl gently to mix (avoid introducing air bubbles into your gel mixture). You will be able to see the orange color of the GelStar become uniformly distributed. *GelStar binds DNA and, as such, is a suspected carcinogen. Wear gloves when handling anything containing GelStar, including your gel once it is solidified! 4. Insert a 10-well comb in your gel tray and set the tray in the gel box so that the tray is closed off on all four sides. The rubber gasket on the tray forms a seal with the sides of the gel box so that your agarose solution will not leak out of the tray before it has solidified. 5. Allow your agarose solution to cool until the flask is just warm the touch (TIP: check it using the inside of your wrist), then pour it into the tray and remove any bubbles that may be present (they can be popped or moved to the sides of the gel with a pipette tip). Do not let the solution cool to the point where it starts to solidify in the flask—if it does so, you will need to reheat it! 6. After the agarose has solidified (~10-15 minutes--the gel should appear uniformly opaque), lift the casting tray and reinsert it into the chamber so that ends of the gel will come into contact with the buffer once you add it. Be sure that you put the comb side closest to the negative (black) electrode. (Recall that DNA has an overall negative charge, so it will migrate toward the anode (red, positive electrode: "run to red") when the current is applied.) 7. Add enough 1x TAE buffer to cover the gel (about 300-350 ml) and then carefully take out your comb. APPENDIX B: Gel Electrophoresis 1. Place the electrophoresis cell lid in position. Be sure the negative (black) electrode is at the end of the chamber nearest the wells. 2. With the power supply off, connect the cables from the cell to the power supply, red to red (positive), and black to black (negative). 3. Set the voltage range to "low" and turn the voltage knob to its lowest setting. Ensure that the display selector switch is set to "volts." 4. Turn the unit on and increase the voltage to the desired level (~93V in this case). The voltage will remain constant during the run. 5. Unless otherwise indicated, electrophorese until the bromphenol blue in the sample solution has migrated to within 0.25 cm of the positive electrode end of the gel. This will take approximately 60-90 minutes. (Bromphenol blue is used as a tracking dye enabling you to follow the progress of an electrophoretic run). 6. At the end of the electrophoretic separation, shut off the power supply, disconnect the cables and remove the gel and gel casting tray together. (Wear gloves!) Be careful not to let the gel slide off the tray. 7
