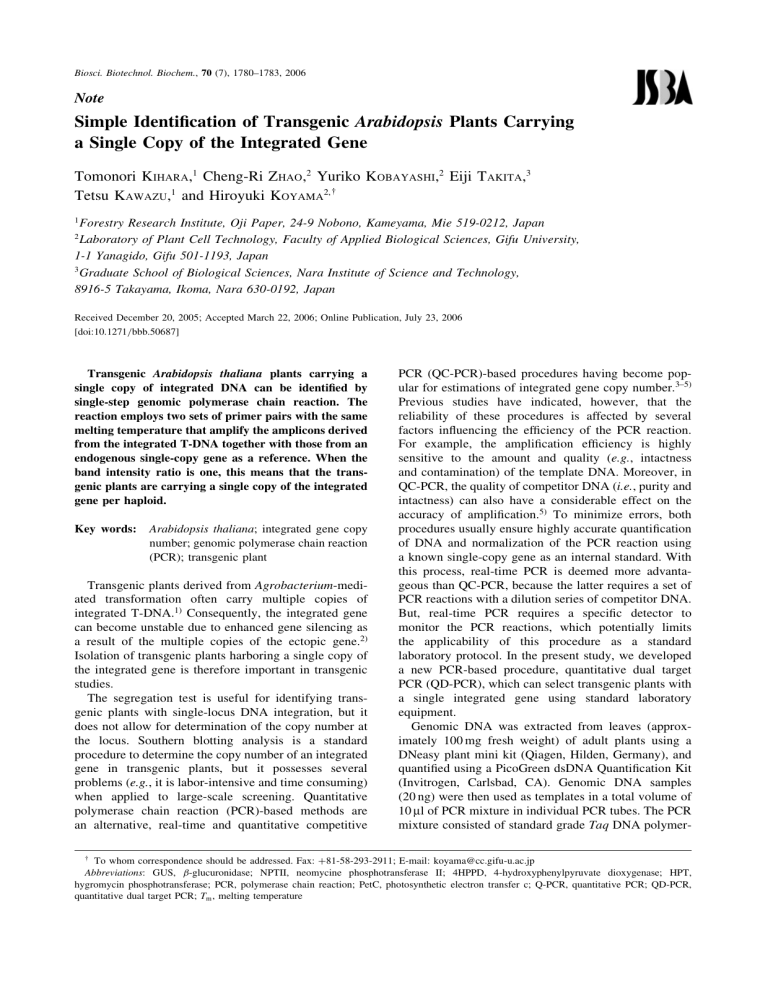
Biosci. Biotechnol. Biochem., 70 (7), 1780–1783, 2006 Note Simple Identification of Transgenic Arabidopsis Plants Carrying a Single Copy of the Integrated Gene Tomonori K IHARA,1 Cheng-Ri Z HAO,2 Yuriko K OBAYASHI,2 Eiji T AKITA,3 Tetsu K AWAZU,1 and Hiroyuki K OYAMA2; y 1 Forestry Research Institute, Oji Paper, 24-9 Nobono, Kameyama, Mie 519-0212, Japan Laboratory of Plant Cell Technology, Faculty of Applied Biological Sciences, Gifu University, 1-1 Yanagido, Gifu 501-1193, Japan 3 Graduate School of Biological Sciences, Nara Institute of Science and Technology, 8916-5 Takayama, Ikoma, Nara 630-0192, Japan 2 Received December 20, 2005; Accepted March 22, 2006; Online Publication, July 23, 2006 [doi:10.1271/bbb.50687] Transgenic Arabidopsis thaliana plants carrying a single copy of integrated DNA can be identified by single-step genomic polymerase chain reaction. The reaction employs two sets of primer pairs with the same melting temperature that amplify the amplicons derived from the integrated T-DNA together with those from an endogenous single-copy gene as a reference. When the band intensity ratio is one, this means that the transgenic plants are carrying a single copy of the integrated gene per haploid. Key words: Arabidopsis thaliana; integrated gene copy number; genomic polymerase chain reaction (PCR); transgenic plant Transgenic plants derived from Agrobacterium-mediated transformation often carry multiple copies of integrated T-DNA.1) Consequently, the integrated gene can become unstable due to enhanced gene silencing as a result of the multiple copies of the ectopic gene.2) Isolation of transgenic plants harboring a single copy of the integrated gene is therefore important in transgenic studies. The segregation test is useful for identifying transgenic plants with single-locus DNA integration, but it does not allow for determination of the copy number at the locus. Southern blotting analysis is a standard procedure to determine the copy number of an integrated gene in transgenic plants, but it possesses several problems (e.g., it is labor-intensive and time consuming) when applied to large-scale screening. Quantitative polymerase chain reaction (PCR)-based methods are an alternative, real-time and quantitative competitive PCR (QC-PCR)-based procedures having become popular for estimations of integrated gene copy number.3–5) Previous studies have indicated, however, that the reliability of these procedures is affected by several factors influencing the efficiency of the PCR reaction. For example, the amplification efficiency is highly sensitive to the amount and quality (e.g., intactness and contamination) of the template DNA. Moreover, in QC-PCR, the quality of competitor DNA (i.e., purity and intactness) can also have a considerable effect on the accuracy of amplification.5) To minimize errors, both procedures usually ensure highly accurate quantification of DNA and normalization of the PCR reaction using a known single-copy gene as an internal standard. With this process, real-time PCR is deemed more advantageous than QC-PCR, because the latter requires a set of PCR reactions with a dilution series of competitor DNA. But, real-time PCR requires a specific detector to monitor the PCR reactions, which potentially limits the applicability of this procedure as a standard laboratory protocol. In the present study, we developed a new PCR-based procedure, quantitative dual target PCR (QD-PCR), which can select transgenic plants with a single integrated gene using standard laboratory equipment. Genomic DNA was extracted from leaves (approximately 100 mg fresh weight) of adult plants using a DNeasy plant mini kit (Qiagen, Hilden, Germany), and quantified using a PicoGreen dsDNA Quantification Kit (Invitrogen, Carlsbad, CA). Genomic DNA samples (20 ng) were then used as templates in a total volume of 10 ml of PCR mixture in individual PCR tubes. The PCR mixture consisted of standard grade Taq DNA polymer- y To whom correspondence should be addressed. Fax: +81-58-293-2911; E-mail: koyama@cc.gifu-u.ac.jp Abbreviations: GUS, -glucuronidase; NPTII, neomycine phosphotransferase II; 4HPPD, 4-hydroxyphenylpyruvate dioxygenase; HPT, hygromycin phosphotransferase; PCR, polymerase chain reaction; PetC, photosynthetic electron transfer c; Q-PCR, quantitative PCR; QD-PCR, quantitative dual target PCR; Tm , melting temperature Identification of a Single Copy Transgenic Plant 1781 Table 1. Sequences and Tm Values of Primers Used in Quantitative Dual Target PCR for Determination of the Copy Number of T-DNA Integrated into the Arabidopsis thaliana Genome 4HPPD F1 R1 PetC F1 R1 HPT F1 R1 F2 R2 T-DNA F1 R1 A. thaliana endogenous (At1g06570) 50 -GCGCTTCCATCACATCGAGTTC 50 -AATCCAATGGGAACGACGACGC A. thaliana endogenous (At4g03280) 50 -TAAGACTCATGGTCCCGGTGAC 50 -ACCATGGAGCATCACCAGTCCT Transgene 50 -GAGGGCGAAGAATCTCGTGC 50 -GATGTTGGCGACCTCGTATTGG 50 -CGAGAAGTTTCTGATCGAAA 50 -CAGTCAATGACCGCTGTTAT Transgene 50 -CCTTGGTTTGTGAAGCAAGCCTTGAA 50 -TGGCTCTAATTCCCAAATGGCTCAAG Tm ( C) Amplicon size (bp) 60.4 60.4 520 60.4 60.4 507 60.4 60.4 52.2 54.2 609 60.5 60.5 618 624 The Tm value was calculated according to the following equation: Tm ð CÞ ¼ 60:8 þ 0:41 ð%GCÞ ð500=nÞ, where %GC is the GC content in the oligonucleotide (%) and n is the length of the oligonucleotide (bp). 4HPPD, 4-hydroxyphenylpyruvate dioxygenase; PetC, photosynthetic electron transfer c; HPT, hygromycin phosphotransferase ase (0.35 units per tube; Invitrogen), 100 mM dNTPs and 0.5 mM each of two sets of primer pairs targeting the integrated T-DNA (HPT gene; AY818364, or the TDNA region itself in SALK T-DNA lines; http://signal. salk.edu/pBIN-pROK2.txt-new), and a known single copy gene (4-hydroxyphenylpyruvate dioxygenase [4HPPD; At1g06570] and photosynthetic electron transfer c [PetC; At4g03280] respectively) (Table 1).6,7) The PCR reaction was carried out with up to 22 cycles of 94 C for 30 s, 58 C for 30 s, and 72 C for 1 min. After PCR, samples were loaded onto regular agarose gel (1.5%, w/v) and visualized by ethidium bromide staining. The gel image was captured by FAS III (Toyobo, Osaka, Japan), and the band intensity was quantified using NIH image software (http://rsb.info. nih.gov/nih-image). As a reference for determination of the integrated T-DNA copy number, real-time PCR was performed using LightCycler (Roche Diagnostics, Basel, Switzerland) with LightCycler FastStart DNA Master SYBR Green I (Roche Diagnostics) according to the manufacturer’s protocol. Copy numbers of the target and internal standard gene in 20 ng genomic DNA were quantified relative to the known amount (0.032–4 atto mol) of plasmid DNA containing each gene. The copy number of the integrated gene was then normalized by that of the internal standard gene. As described above, with PCR, normalization of template DNA is necessary to quantify the copy number of an integrated gene, the ‘‘target gene,’’ because amplification efficiency is sensitive to the purity and intactness of the template DNA. This step is usually carried out by quantification of an internal single-copy gene as a reference. Both QC-PCR and real-time PCR carry out this step separately from quantification of the target DNA, but the proposed QD-PCR technique can run both steps simultaneously in the same PCR reaction. This reduces the necessary labor and cost of isolation of transgenic plants carrying a single copy of the integrated DNA, and minimizes errors that can occur as a result of slight differences between PCR reactions (e.g., differences in the amount of template genomic DNA in the various PCR reactions). In QD-PCR, the target gene is amplified together with the internal standard gene using two sets of PCR primer pairs in a single PCR reaction. As described above, this is advantageous as compared to other PCR-based methods. But, if the amplification efficiency were to vary between the target and the internal standard gene, errors would occur during identification of transgenic plants carrying a single copy of the integrated gene. Hence we determined the amplification efficiency of HPT in the integrated T-DNA and authentic single-copy genes (4HPPD and PetC) in transgenic plants carrying a single copy of the integrated gene as a result of separated real-time PCR reactions (Fig. 1A). When we used primer pairs with exactly the same Tm values (see Table 1), all amplicons showed very similar amplifications. Hence we inferred that both the target (HPT) and internal control genes (4HPPD and PetC) are amplified at a very similar rate in the QD-PCR reaction. To determine whether this does in fact take place, we performed a series of reactions with genomic DNA extracted from transgenic Arabidopsis carrying single and double copies of the integrated T-DNA, which was identified by southern blotting analysis and quantification of the copy number of the integrated T-DNA containing the HPT gene by competitive PCR in our previous studies.5,8) First we examined the effect of PCR cycles on the band intensity ratio of the target (HPT) and the internal control gene (4HPPD) (Fig. 1B, C). We were able to detect both bands after 18 cycles, after which the band intensity sharply increased (Fig. 1B). The ratio of HPT to 4HPPD amplicon in the single-copy plant was close to 1782 T. KIHARA et al. A A Fluorescence 100 1 2 3 4 5 HPT 4HPPD 1.1 1.2 0.5 0.4 Ratio ± 0.1 ± 0.0 ± 0.0 ± 0.0 (HPT/4HPPD) 10 1 Amplification efficiency HPT ( ) 1.84±0.01 4HPPD( ) 1.85±0.02 PetC ( ) 1.81±0.01 0.1 15 17 19 21 23 25 27 29 31 Number of cycles 0* 97* 88* 70* 64* Segregation test (Survival/100 seeds) B Homozygous Heterozygous B Single copy 18 19 C Double copy 20 21 22 1.2 0.9 1.0 1.2 1.1 ± 0.1 ± 0.0 ± 0.0 ± 0.1 ± 0.0 D I 18 19 20 21 22 cycles HPT 4HPPD Ratio 1.9 1.7 1.8 1.4 1.3 ± 0.1 ± 0.1 ± 0.1 ± 0.1 ± 0.1 (HPT/4HPPD) 1 HPT 4HPPD 3 1 2 3 T-DNA PetC 5.5 1.1 0.9 8.8 0.5 0.6 Ratio ± 0.7 ± 0.1 ± 0.0 ± 0.5 ± 0.1 ± 0.0 (T-DNA/PetC) 6 II 2 1 1 9 0.5 0.5 Copy number estimated by real-time PCR Fig. 1. Amplification of HPT, 4HPPD, and PetC Genes from the Genome of Transgenic Arabidopsis Plants Using Real-Time PCR and QD-PCR. Real-time PCR and QD-PCR reactions were carried out with 20 ng of each genomic DNA derived from single- (A, B, and D) or double- (C) copy transgenic plants. The increase in SYBR green fluorescence was caused by amplification of either the internal standard gene (4HPPD and PetC) or the integrated gene (HPT) in the real-time PCR reaction (A). The QD-PCR reaction was carried out for 18–22 cycles in B and C and 20 cycles in D. In the QD-PCR results, the lower band represents the internal single-copy gene (4HPPD). The Tm values of all primers were identical in the reactions shown in A, B, C, and DI, but that of HPT in DII was lower than the others. Values shown in the bottom of B and C represent the band intensity ratio determined by the NIH image (means SD, n ¼ 3). Fig. 2. Identification of Transgenic Arabidopsis Plants Carrying a Single Copy of Integrated T-DNA by QD-PCR. The ratios of target (A, HPT; B, T-DNA region) to control (A, 4HPPD; B, PetC) genes were obtained using gel images (n ¼ 3, means SD). A, The QD-PCR reaction was carried out with homozygous (Lane 2, 3) and heterozygous (Lane 4, 5) transgenic lines carrying a single copy of the integrated HPT gene. The upper band represents the HPT amplicons. Lane 1 is a null line. The number of Hyg-resistant plants among 100 seed progenies is shown below the gel image. Asterisks were attached if the value could be adapted to Mendelian segregation at P ¼ 0:01 using the 2 test. B, The QD-PCR reaction was carried out with one homozygous and heterozygous T-DNA insertion line selected from three different SALK seed lots according to the method of Siebert et al.9) Homozygous and heterozygous plants derived from the same seed lot were given the same number. Lower bands indicate the PetC amplicons. The copy number estimated using real-time PCR is shown below the gel image (n ¼ 3). one, while that in the double-copy transgenic plant was close to two after 18–20 cycles (Fig. 1C). However, the ratio of the latter sharply decreased after 21–22 cycles. These results indicate that estimation of copy number using QD-PCR is reliable only when the PCR reaction is not saturated (< 20 cycles). Secondly, we examined the effect of the melting temperature (Tm ) of the PCR primers on the accuracy of the QD-PCR reaction. In the above experiments, we designed PCR primers with exactly the same Tm value (60.4 C; Table 1). This gave both the target gene (HPT) and the control gene (4HPPD) the same amplification efficiency (Fig. 1B, D, lane I), but the intensity of the HPT amplicon was weaker than that of the control gene when the Tm values of the former primers (52.2 and 54.2 C; Table 1) were lower than those of the control gene (Fig. 1D, lane II). From these results, we concluded that the Tm values of the primers must be equal for an accurate QD-PCR reaction. Finally, we tested the capability of the QD-PCR method in identification of homozygous transgenic plants carrying a single copy of the integrated DNA. Using HPT and 4HPPD as target and control genes respectively, we applied the QD-PCR method to the same T2 population from which we obtained single copy homozygous plants, confirmed using quantitative competitive PCR.5) In this case, homozygous transgenic plants should give the same intensity for both target and control amplicons, while the intensity of the target amplicon in heterozygous (i.e., 0.5 copies per haploid) plants should be almost half that of the control gene. As shown in Fig. 2A, two transgenic plants (lanes 2 and 3) were judged homozygous because of similar band intensities. On the other hand, two transgenic plants (lanes 4 and 5) appeared to be heterozygous because the intensity of the target (HPT) amplicon was half that of the control. These estimations were in accordance with the genotypes determined using the segregation test with seed progenies of each plant (Fig. 2A). Because amplicons of HPT and 4HPPD, which have a different GC content, were amplified with the same efficiency, the method should be reliable when a different combination of target and control genes is used. SALK T-DNA lines carrying the NPTII gene in the integrated DNA are usually supplied as a mixture of heterozygous, homozygous, and null segregants in terms Identification of a Single Copy Transgenic Plant of the genotype at the identified locus of the T-DNA insertion in the SALK catalog (http://signal.salk.edu). Using the method of Siebert et al.,9) we examined the genotype of the T-DNA insertion at the identified locus in the SALK catalog, isolating one homozygous and heterozygous plant from three different lines. When we applied the QD-PCR method with two primer sets for the T-DNA region as a target and PetC as an internal control gene, we were able to identify lines 2 and 3 as carrying a single copy of the integrated T-DNA (Fig. 2B). This was identical to the copy number of the NPTII gene, as quantified by real-time PCR. On the other hand, line 1 contained multiple copies as a result of T-DNA insertion at multiple loci, as also mentioned by SALK. In this case, plants heterozygous at the locus identified by SALK appeared to include a larger amount of T-DNA in the genome than the plant identified as being homozygous at the same locus. Copy numbers judged by QD-PCR were almost identical to those confirmed by real-time PCR, but a relatively large standard deviation was observed (Fig. 2B). Hence we concluded that QD-PCR can be performed with various combinations of target and internal standard genes. In conclusion, QD-PCR was shown to be highly reliable for identification of transgenic lines with a single copy of the integrated gene (Fig. 2). The sensitivity of QD-PCR quantification appeared to be sufficient for direct identification of two-fold differences in the copy number of the integrated DNA using gel images (i.e., single and double [Fig. 1B, C] or heterozygous and homozygous single-copy transgenic plants [Fig. 2]). This suggests that single-copy transgenic plants can easily be identified in the T1 generation, where single-copy plants are expected to show about half the intensity of signals for the target amplicons compared to the control genes. Moreover, because of the simple handling of the reaction, this method is useful for the selection of single-copy transgenic plants in transgenic studies and crop breeding. Acknowledgments This work was supported by the Research Institute of Innovative Technology for the Earth (RITE) and the Ministry of Economy, Trade and Industry of Japan. We 1783 are grateful to Miss Hiromi Inagaki of Gifu University for technical assistance. References 1) 2) 3) 4) 5) 6) 7) 8) 9) Grevelding, C., Fantes, V., Kemper, E., Schell, J., and Masterson, R., Single-copy T-DNA insertions in Arabidopsis are the predominant form of integration in rootderived transgenics, whereas multiple insertions are found in leaf discs. Plant Mol. Biol., 23, 847–860 (1993). Lechtenberg, B., Schubert, D., Forsbach, A., Gils, M., and Schmidt, R., Neither inverted repeat T-DNA configurations nor arrangements of tandemly repeated transgenes are sufficient to trigger transgene silencing. Plant J., 34, 507–517 (2003). Mason, G., Provero, P., Vaira, A. M., and Accotto, G. P., Estimating the number of integrations in transformed plants by quantitative real-time PCR. BMC Biotechnol., 2, 20 (2002). Bubner, B., Gase, K., and Baldwin, I. T., Two-fold differences are the detection limit for determining transgene copy numbers in plants by real-time PCR. BMC Biotechnol., 4, 14 (2004). Honda, M., Muramoto, Y., Kuzuguchi, T., Sawano, S., Machida, M., and Koyama, H., Determination of gene copy number and genotype of transgenic Arabidopsis thaliana by competitive PCR. J. Exp. Bot., 53, 1515–1520 (2002). Garcia, I., Rodgers, M., Pepin, R., Hsieh, T. F., and Matringe, M., Characterization and subcellular compartmentation of recombinant 4-hydroxyphenylpyruvate dioxygenase from Arabidopsis in transgenic tobacco. Plant Physiol., 119, 1507–1516 (1999). Knight, J. S., Duckett, C. M., Sullivan, J. A., Walker, A. R., and Gray, J. C., Tissue-specific, light-regulated and plastid-regulated expression of the single-copy nuclear gene encoding the chloroplast rieske FeS protein of Arabidopsis thaliana. Plant Cell Physiol., 43, 522–531 (2002). Koyama, H., Kawamura, A., Kihara, T., Hara, T., Takita, E., and Shibata, D., Overexpression of mitochondrial citrate synthase in Arabidopsis thaliana improved growth on a phosphorus-limited soil. Plant Cell Physiol., 41, 1030–1037 (2000). Siebert, P. D., Chenchik, A., Kellogg, D. E., Kukyanova, K. A., and Lukyano, S. A., An improved PCR method for walking in uncloned genomic DNA. Nucl. Acids Res., 23, 1087–1088 (1995).


