International Journal of Trend in Scientific Research and Development (IJTSRD)
Special Issue on International Research Development and Scientific Excellence in Academic Life
Available Online: www.ijtsrd.com e-ISSN: 2456 – 6470
Determining the Absolute Height of the Ground using the
Global Mapper Program and Creating the Relief of Eroded
Lands on the Basis of an Automated System
Shoxrux Fayziev, Zulfizar Esanova, Nuriddin Abdiraxmatovich Abdiraxmatov
Senior Lecturer, Karshi Engineering and Economic Institute, Karshi, Uzbekistan
KEYWORDS: Height, database, format, icon, topography,
topographic map, eroded areas, coordinates
where the altitude database is stored. As mentioned
above, the program describes the terrain based on the
elevation data of the place, which makes the use of the
map a bit more complicated. But there is an
opportunity to solve this problem through software.
All you have to do is link the thematic map of the area
to the relief map. As a result, the program first places a
relief image of the place and a thematic map on it. To
create 3D geospatials based on GIS technology, we
need an altitude database and raster images.
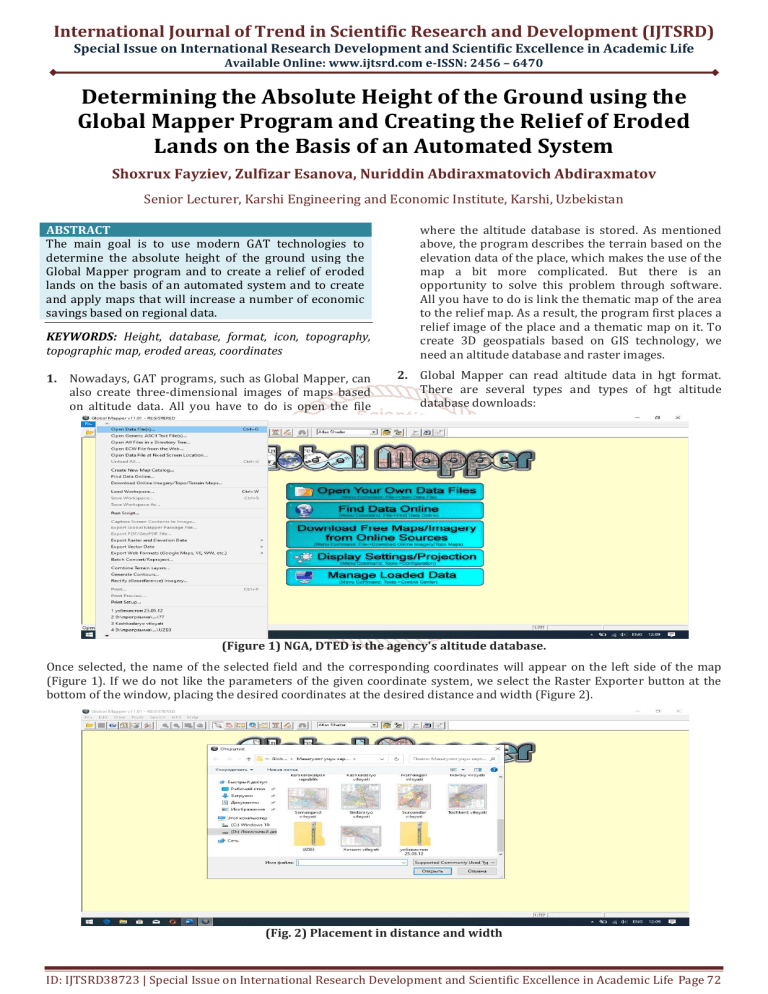
1. Nowadays, GAT programs, such as Global Mapper, can
also create three-dimensional images of maps based
on altitude data. All you have to do is open the file
2. Global Mapper can read altitude data in hgt format.
There are several types and types of hgt altitude
database downloads:
ABSTRACT
The main goal is to use modern GAT technologies to
determine the absolute height of the ground using the
Global Mapper program and to create a relief of eroded
lands on the basis of an automated system and to create
and apply maps that will increase a number of economic
savings based on regional data.
(Figure 1) NGA, DTED is the agency's altitude database.
Once selected, the name of the selected field and the corresponding coordinates will appear on the left side of the map
(Figure 1). If we do not like the parameters of the given coordinate system, we select the Raster Exporter button at the
bottom of the window, placing the desired coordinates at the desired distance and width (Figure 2).
(Fig. 2) Placement in distance and width
ID: IJTSRD38723 | Special Issue on International Research Development and Scientific Excellence in Academic Life Page 72
International Journal of Trend in Scientific Research and Development (IJTSRD) @ www.ijtsrd.com eISSN: 2456-6470
As a result, the height database of the selected area will appear in the form of a zip file (Figure 3). When you select this file,
the database will be automatically uploaded to your computer. Just show us where to copy the file. During the download
process, it is recommended that you name the area in the file that contains the elevation data. For example, altitude and
map for Tashkent.
(Figure 3) Height for Tashkent city
To get started in the Global Mapper app, double-click the Global Mapper icon. After a few seconds, the program window
will open (Figure 4). We will do this on the example of Tashkent.
(Figure 4) “Opening the data file”.
Select the file menu on the toolbar of the window and select the "Open data file" dialog. Then from the folder where the
height data is stored, click on the zip file of the zip archiver file in hgt format, corresponding to the city of Tashkent.
(Figure 5) Open the zip file in hgt format corresponding to Tashkent, "Open".
ID: IJTSRD38723 | Special Issue on International Research Development and Scientific Excellence in Academic Life Page 73
International Journal of Trend in Scientific Research and Development (IJTSRD) @ www.ijtsrd.com eISSN: 2456-6470
As a result, the program describes the relief view of the selected area in the nomenclature. The left and right sides of the
image, along with the grids, show the cartographic distance and latitude. In addition, on the left side of the program
window, the elevation data of the area are displayed in color in a hypsometric way
(Figure 6) Nomenclature area
The reference points can be the intersection of topographic grid lines, turning points of land use boundaries and the mark
of settlements.
(Figure 7) Definition of boundary turning points and settlements
This dialog shows 3 different types of windows. Window 1 shows our
our first topographic raster map, window 2 shows a
magnified map (to select coordinate values), and window 3 shows a relief map. Enlarge the map in window 2, select point
1, and in window 3, select the location that corresponds to this coordinate and place point 1. Then click the "Add Point"
button and save the checkpoint. In this way, we select at least 4 high-resolution
high resolution points and memorize them.
In this way, we select at least 4 high-resolution
resolution points and memorize them.
Once we have saved the points, we click
ick the "Accept" button, which will help us to accept the entered coordinate points.
Click OK.
ID: IJTSRD38723 | Special Issue on International Research Development and Scientific Excellence in Academic Life Page 74
International Journal of Trend in Scientific Research and Development (IJTSRD) @ www.ijtsrd.com eISSN: 2456-6470
(Figure 8) Acceptance of coordinate points
The relief map serves as the base card when we create a 3D map. After we connect the topographic map to the base map,
the program places the base card first and then the topographic map in a layer view.
3. Using the above software sequence, the process of updating topographic maps is followed on the basis of the following
step and the map is generated as follows. on the basis of which a number of symbols are equipped with additional
diagrams. As a result, data on all indicators of the surveyed area were reflected.
4. Conclusion.
Thus, by using the Global Mapper program to determine
the absolute height of the land and create a relief of eroded
lands on the basis of an automated system, the region's
agricultural land can be used extensively in the
development of measures on soil eroded lands using the
Global Mapper program. In addition, in the production of a
number of relevant industry representatives can be used
to generate relief data and obtain distance markings to
determine the distance.
5. References.
[1] Берлянт А. М. Геоиконика-М.: МГУ, АЕН РФ,
«Астрея», 1996 г.
[2]
[3]
[4]
[5]
Paul Longley et al. Geographic Information Systems
and Science.-UK 2nd Edition “Joxn wiley & Sons Ltd.,
2005. – 517 p
Мирзиёев Ш.М. Танқидий таҳлил, қатьий тартиб
- интизом ва шахсий жавобгарлик – хар бир
рахбар фаолиятининг кундалик қоидси бўлиши
керак. Тошкент,Ўзбекистон, 2017.- 104б.
Мирзиёев
Ш.
М.
Ўзбекистонни
ривожлантиришнинг бешта устувор йўналиши
бўйича Ҳаракатлар стратегияси. Т., Ўзбекистон,
2017. «Газета.uz».
[6]
Самардак А. С.. Геоинформационные систимы.
Владивасток 2005.- 124
[7]
Michael N. DeMers. Fundamentals of Geographic
Information Systems, 3rd Edition, New Mexico State
Univ, 2005. - 642 p
[8]
Peter A. Burrougx and Rachael A. McDonnell.
Principles of Geographic al Information Systems.
Oxford University Press. 1998
[9]
Бугаевски
Л.
М.
Цветков
В.
Геоинформационные системы. Москва, 2000
Я.
[10] С. В. Гарбук, И. Е. Гершензон. Космические
системы дистанционного зондирование земли.
M.: издателстьво A И Б, 1997.-296 с.,
[11] Фуфаев Д.Е. Базы данныx. Учебное пособие для
ССУЗов. Академия. 2006-320 с
Websites
[12] http://gis.iitam.omsk.net.ru/
[13] http://gisa.ru
[14] http://esri.com
[15] www.gisinfo.ru/ [16] www.dataplus.ru.
B. Bxatta. Remote Sensing and GIS.-Delxi.Oxford
Xigxer Education, 2008. – 685p
ID: IJTSRD38723 | Special Issue on International Research Development and Scientific Excellence in Academic Life Page 75


