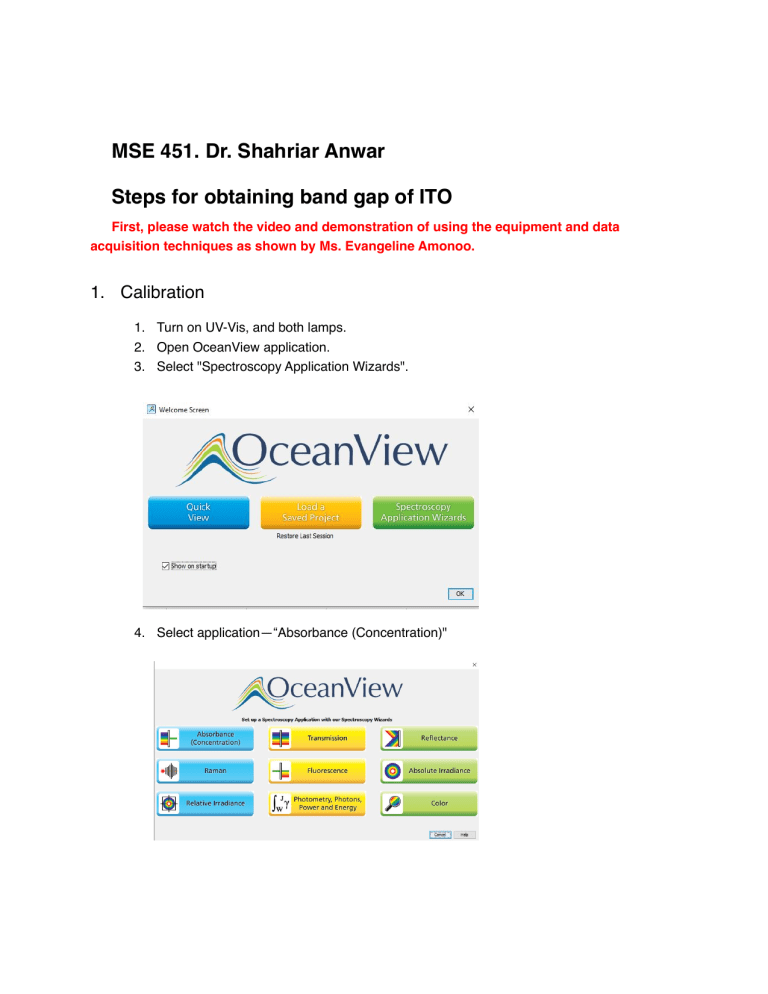
MSE 451. Dr. Shahriar Anwar Steps for obtaining band gap of ITO First, please watch the video and demonstration of using the equipment and data acquisition techniques as shown by Ms. Evangeline Amonoo. 1. Calibration 1. Turn on UV-Vis, and both lamps. 2. Open OceanView application. 3. Select "Spectroscopy Application Wizards". 4. Select application—“Absorbance (Concentration)" 5. Option – “Absorbance only” 6. Place blank slide in holder. 7. Set the shutter switch to “Open” (move switch to the left). 8. Click “Automatic” to automatically set the integration time, making sure the entire spectrum is visible (repeat clicking till spectrum is just below the horizontal blue line). This procedure is to maximize the signal, but avoid clipping the signals. 9. Set “Scans to average” to 3, and “Boxcar width” to 25, for improved S/N ratio. 1 10. Click next. 11. Save reference spectrum by clicking on the light bulb icon. Wait till reference is acquired. 12. Click next. 13. Set the shutter switch to “Close” (Middle position). 14. Save the background signal (store background, dark light bulb icon). 15. Click Finish. 16. We are now in the absorbance mode. 2. Data acquisition 1. Remove reference sample, and load test sample. 2. Set the shutter switch to “Open” (move switch to the left). 3. Record absorbance data. 2 4. Click “Configure graph saving” (Wrench and paper icon) and change target directory. 5. Pause acquisition using the pause icon. 6. Click “Save graph to files”. 7. Set the shutter switch to “Close” (Middle position). 8. Repeat for next sample. 3. Analysis 1. Open ascii file in MATLAB. αhc hc 2. Method A: Given absorbance, α, as a function of λ, calculate and . ( λ ) λ 2 αhc hc 3. Plot on y-axis vs on x-axis. This is known as a Tauc Plot. ( λ ) λ 2 4. Subtract the background (i.e. baseline correction). 5. Extrapolate the straight-line part of the absorption edge to intersect the x-axis. The resultant x intercept is the bandgap energy. 6. Method B: Determine the band gap by just extrapolating the absorbance edge to the horizontal axis (wavelength). Please don't forget to baseline correct the data. 4. Plot the absorbance data of the two ITO samples and determine their bandgaps using the procedure outlined in Method A above (Tauc plot) and by Method B and enter the data in the table below. Sample Speed (ccm/min) O2/Ar (%) t (nm) µ (cm^2/Vs) n (cm^-3) µ/n A 115 40 16/13 59.2 1.1E+20 5.38 K 8 20 258/261 9.4 3.2E+19 2.94 3 Bandgap (Tauc) Bandgap (edge) Comment on the difference of the values dependent on the oxygen partial pressure during the fabrication process. 5. Plot the absorbance data for the TiO2 specimen and determine the band gap energy. To make it simpler for you we ask to determine the band gap by just extrapolating the absorbance edge to the horizontal axis (wavelength). Please don't forget to baseline correct the data. Compare your value to the known bandgap value and report the accuracy of your analyzed value. Please note that there are a number of possible phases of TiO2 . Some possibilities are the anatase, brookite, and rutile phases.The specimen that we are using is the rutile phase. What is the crystal system for this specimen and what are the lattice parameters? Please construct a unit cell of the rutile structure in CrystalMaker and present it in your report. 6. What is the wavelength associated with this bandgap for TiO2 and where is it in the electromagnetic spectrum? 7. Looking at the absorbance spectrum what can you say about possible applications of TiO2? Please look up other uses of TiO2 . 8. We will continue with the bandgap lab and will add additional exercises and questions next time. Comments about Indium tin oxide (ITO) ITO is a compound of varying proportions of indium, tin, and oxygen. It is transparent and colorless in thin layers, but can look yellowish to greenish to grey in bulk. It is very widely used due to its conductive properties and transparency. Depending on the application, a compromise needs to be made since increasing the conductivity decreases its transparency. ITO is a heavily doped semiconductor. Undoped In2O3 is an insulator. Conducting In2O3 is heavily doped with tin donors (1020 to 1021 cm-3). The conductivity of the ITO is due to the electrons donated to the conduction band. In this material the free electrons stem from two sources, tin atoms and oxygen vacancies (missing oxygen atoms) and is slightly substoichiometric instead of In2O3:SnO2. The films that we are analyzing in this lab were deposited by sputtering and they are naturally sub-stoichiometric. Now, think of what would happen if we add some more oxygen. Will it increase or reduce the number of charge carriers? Will it then make the material more conductive (less transparent) or less conductive (more transparent)? Actually, what is happening here is that as we add some oxygen during sputtering we fill some 4 of the oxygen vacancies and thus reduce the number of free electrons which in turn makes the material less conductive. Does your bandgap calculations of the A and K samples confirm this expectation? Ignore the thickness data, but look at the oxygen partial pressures and the flow rates during the sputtering process when pondering your answer to this question. 5


