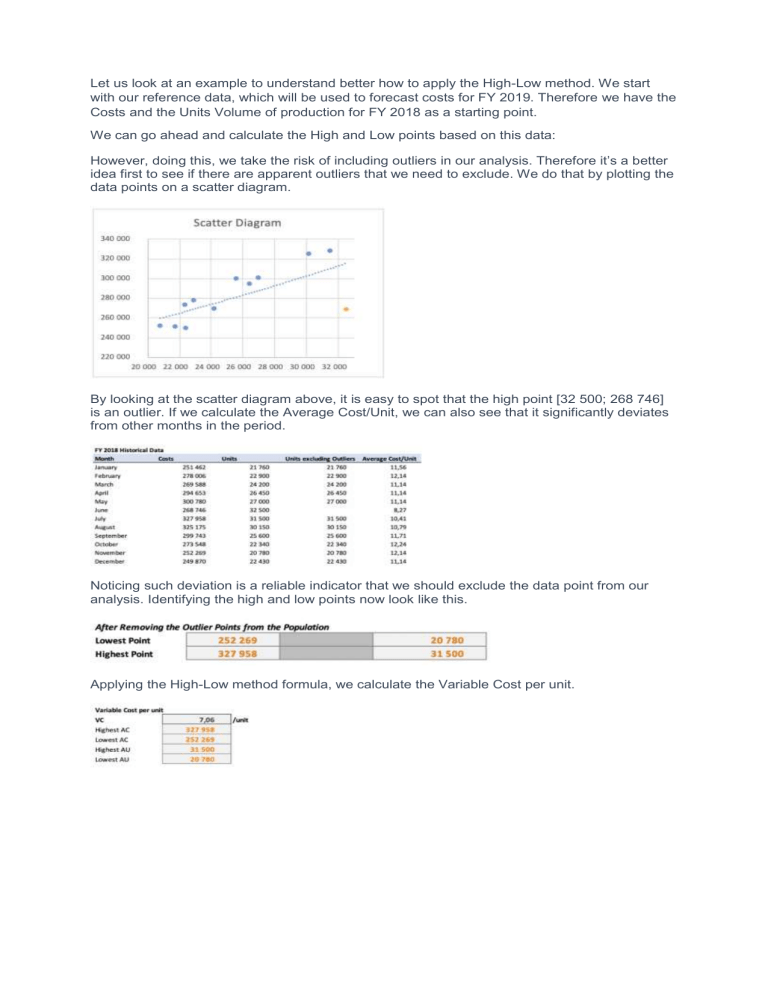
Let us look at an example to understand better how to apply the High-Low method. We start with our reference data, which will be used to forecast costs for FY 2019. Therefore we have the Costs and the Units Volume of production for FY 2018 as a starting point. We can go ahead and calculate the High and Low points based on this data: However, doing this, we take the risk of including outliers in our analysis. Therefore it’s a better idea first to see if there are apparent outliers that we need to exclude. We do that by plotting the data points on a scatter diagram. By looking at the scatter diagram above, it is easy to spot that the high point [32 500; 268 746] is an outlier. If we calculate the Average Cost/Unit, we can also see that it significantly deviates from other months in the period. Noticing such deviation is a reliable indicator that we should exclude the data point from our analysis. Identifying the high and low points now look like this. Applying the High-Low method formula, we calculate the Variable Cost per unit. What is an outlier? In cost accounting, an outlier could be a cost or its related level of activity that is out of line with other observations. An outlier can be detected by plotting each observation's cost and related level of activity onto a graph or scatter diagram. If one of those points deviates from the pattern of the other points, it is said to be an outlier. The outlier could be the result of an accounting error, an unusual charge, or a unique change in volume. To avoid developing an incorrect formula for estimating future costs, the outlier should be investigated and perhaps excluded. the high-low method of determining the fixed and variable portions of a mixed cost relies on only two sets of data: 1) the costs at the highest level of activity, and 2) the costs at the lowest level of activity. If either set of data is flawed, the calculation can result in an unreasonable, negative amount of fixed cost. To illustrate the problem, let's assume that the total cost is $1,200 when there are 100 units of product manufactured, and $6,000 when there are 400 units of product are manufactured. The high-low method computes the variable cost rate by dividing the change in the total costs by the change in the number of units of manufactured. In other words, the $4,800 change in total costs is divided by the change in units of 300 to yield the variable cost rate of $16 per unit of product. Since the fixed costs are the total costs minus the variable costs, the fixed costs will be calculated to a negative $400. This unacceptable answer results from total costs of $1,200 at the low point minus the variable costs of $1,600 (100 units times $16), or total costs of $6,000 at the high point minus the variable costs of $6,400 (400 units times $16). The negative amount of fixed costs is not realistic and leads me to believe that either the total costs at either the high point or at the low point are not representative. This brings to light the importance of plotting or graphing all of the points of activity and their related costs before using the high-low method. (The number of units uses the scale on the x-axis and the related total cost at each level of activity uses the scale on the y-axis.) It is possible that at the highest point of activity the costs were out of line from the normal relationship—referred to as an outlier. You may decide to use the second highest level of activity, if the related costs are more representative. If the $6,000 of cost at the 400 units of activity is an outlier, you might select the next highest activity of 380 units having total costs of $4,000. Now the variable rate will be the change in total costs of $2,800 ($4,000 minus $1,200) divided by the change in the units manufactured of 280 (380 minus 100) for a variable rate of $10 per unit of product. Using the variable rate of $10 per unit manufactured will result in the fixed costs being a positive $200. The positive $200 of fixed costs is calculated at either 1) the low activity: total costs of $1,200 minus the variable costs of $1,000 (100 units at $10); or at 2) the high activity: total costs of $4,000 minus the variable costs of $3,800 (380 units at $10) Relevant Range and Behavior of Costs Example of Fixed Cost ‘Fixed cost is fixed only in relevant range’. We normally understand supervisor salary as fixed cost because that does not vary with the production. Now, look at the example below: If there are 2 machines producing 500 units each per year and is supervised by 1 supervisor. He can supervise another 3 machine if installed nearby them. So, till the requirement of the company is 2500 (500*5) units per year, the same supervisor will handle and cost of supervisor will remain fixed to say $12,000. Over and above the production of 2500 units, the company will have to appoint another manager to supervise 6 th machines onwards. In the example, it is clearly evident that the supervisor cost which is a fixed cost is only fixed till the production is 2500 units. Here, the relevant range and fixed cost relation are as follows: Fixed Cost Behavior at Relevant Ranges Production (In Units) Supervisor Cost (Total Fixed Cost) 1 to 2500 Units $12,000 2501 to 5000 Units $24,000 5001 to 7500 Units $36,000 From the above table and graph, we can make out another interesting thing about the behavior of costs with respect to relevant range. The fixed costs increase like stair steps the term relevant range usually refers to a normal range of volume or normal amount of activity in which the total amount of a company's fixed costs will not change as the volume or amount of activity changes. The term relevant range is included in the definition of fixed costs, because if a company's volume were to decline to an extremely low level, the company would take action to decrease its total amount of fixed costs. Similarly, if the company's volume were to increase dramatically, the company would likely have to increase the total amount of its fixed costs . Example of Relevant Range Let's assume that a manufacturer's monthly production volume is consistently between 10,000 to 13,000 units of product requiring between 20,000 to 25,000 machine hours. Within these ranges of activity, the manufacturing operations run smoothly with the same amount of monthly fixed costs, which on average are approximately $200,000 per month for the cost of supervisors, rent, depreciation, and other fixed costs. However, if the manufacturer's volume were to drop to say 7,000 units of product and/or to 14,000 machine hours, it would likely reduce the number of its supervisors, the space it rents, and some other fixed costs in order to reduce the $200,000 of monthly fixed costs. If the company's volume were to increase to 18,000 units of product and/or 30,000 machine hours, the company would likely have to increase its total fixed costs to pay for additional supervisors, space, and other fixed costs. Hence, an experienced accountant would say that the company's fixed costs are approximately $200,000 per month within a relevant range of activity. Friends Company can produce from 10,000 to 50,000 valves per year. So, the relevant range for Friends Company is the range of normal activity from 10,000 to 50,000 units. Within this relevant range all fixed costs, such as rent, equipment depreciation, and administrative salaries remain constant. If Friends Company decides to produce more valves, they have to hire additional staff and rent more equipment, which will result in an increase of fixed costs. On the contrary, if the production level is reduced, Friends Company has to reduce staff and rental expenses, so fixed costs will decrease.
