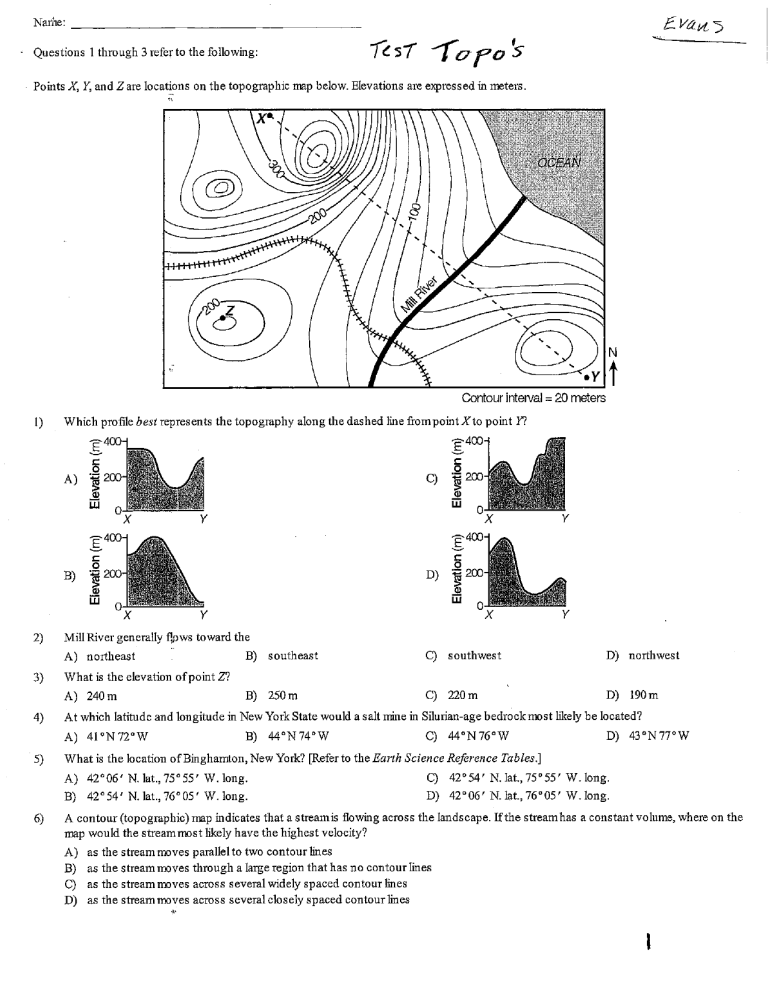
Narhe: Questions 1 through 3 refer to the following: Points X, Y, and Z are locations on the topographic rnap below. Elevations are expressed in reters. r 'Tea;' %OCEA Contour I) Which profile best represents the topography along the dashed line from point X to point Y? o o 200 •j 200 x x —400 @400 o o 200 B) D) 200 x x 2) Mill River generally flows toward the A) northeast 3) What is At which latitude and longitude in A) 410N720W 5) What is 6) southeast C) southwest D) northwest B) 250m C) 220m D) New York State would a salt mine in B) 440N 740 W Silurian-age C) bedrock TIDst likely 440N760W 190m be located? D) 430N770W the location of Binghamton, New York? [Refer to the Earth Science Reference Tables.] A) 42006' N. lat., 75055' 42054' N. lat., 76005' B) B) the elevation of point Z? A) 240m 4) = 20 meters —400 400 A) intejval W. W. long. C) 42054' N. lat., 75055' long. D) 42006' N. lat., 76005' W. long. W. long. A contour (topographic) rnap indicates that a streamis flowing across the landscape. Ifthe stream has map would the stream rmst likely have the highest velocity? A) as the streamn•nves parallel to two contour lines B) as the stream rmves through a large region that has C) as the stream rmves across several widely spaced contour lines no contour lines D) as the stream Tmves across several closely spaced contour lines a constant volume, where on the Questions 7 through 9 refer to the following: Points A, B, C, D, and Xtepresent locations on the nup below. Elevations are measuled in feet. 80 c COO 900 000 00 900 O 7) What is A) 8) B) ft Which 1,599 4 B) 6 miles 5 X on Rock Mountain in the map? C) ft the average yadient of the slope along straight line A) 250 ft/mi 9) 3 the highest possible elevation of point 1,600 What is 2 1 1,699 ft C) cross section best represents the profile along straight line AB in the 500 ft/mi map? 1700 1700 8 1500 = 1300 1500 1300 C) 1100 900 700 B 1700 1700 8 1500 8 1500 = 1300 1300 O 1100 10) 900 900 700 700 How are latitude and longitude lines drawn on a globe of the Earth? A) Latitude lines are parallel and longitude lines meet at the poles. B) Longitude lines are and latitude lines meet at the Equator. C) Longitude lines qreparallel and latitude lines meet at the poles. D) Latitude parallel lines ale parallel and longitude lines 1,601 D) 100 ft/mi ft CD in the map? 1,000 ft/mi 700 D) meet at the Equator. Questions 11 through 13 refer to the following: The diagram below represents the Earth. SonE of the latitude and longitude lines have been labeled. Points through E represent locations on the Earth's surface. NORTH POLE 300 EQUATOR 00 300 Sun's Rays E PRIME MERIDIAN SOUTH POLE 11) What are the approximate latitude and longitude of location A? A) 250N, 1050E 12) The latitude and 13) As B) 250N, 1050W C) longitude of which location are closest to those a traveler goes from location A to location B, the altitude B) A) decrease 1050N,250W D) 1050 S, 250 E ofNew York State? of Polalis will remain the sane C) increase Questions 14 and 15 refer to the following: Pacific Time Zone / Mountain v Time Zone 12 11 10 9 Central Eastern Tme Zone Time Zone New York San Denver Francisco Dallas 14) The dashed boundaties between time zones are how many degrees of longitude apazt? A) 100 15) What is B) the time in San Francisco when 150 it is C) 240 D) 2310 C) 3 a.m. D) 4 6 a.m. in Dallas? 3 am Questions 16 through 18 refer to the following: The map below represents a view of the Earth looking down from above the North Points A, B, C, and Sun's rays are striking the Ealth from the Pole (N.P.), showing the Earth's 24 standard time zones. D are locations on the The Earth's surface. SUNSET 7 p.m. 6 p.m. 5 p.m. 8 p.m. 4 p.m. 3 p.m. p.m. 2 p.m. 10 p.m. 11 p.m. 1 p.m. 12 Noon 12 Midnight Sun's Rays 1 a.m. 11 a.m. 10 a.m. 2 a.m. 9 a.m. 3 a.m. 8 a.m. 4 p.m. 5 a.m. 6 a.m. 7 a.m. SUNRISE 16) Which two points have the A) Band D 17) B) Band C C) Areas within a tinE zone generally keep the sane standard clock time. tine zone? A) 18) same longitude? A and D In degrees D) of longitude, approxinutely At which how wide is one standard D) 150 AandC 300 position would the altitude of the N01th Star (Polatis) be greatest? Questions 19 through 22 refer to the following: The heavy dashed lines on the topographic nup below represent four hiking paths, A, B, C, and D. Point P is a location on the map. 31 ,585 Erie-••.. Lackawanna Railroad 1 *600 Creek q 1 .5 p' Scale 1,600 1 kilometer On this A) 20) 21) centimeter represents I the contour interval for this A) ft 100 What is how many B) 1,600 What is A) 22) map, centimeters on the surface of the Earth? C) 1,900 14,700 25ft the approximate length of the poltion of the Erie-Lackawanna railroad tracks Which path 17,000 D) IOft D) 2.51m lines show depressions. map? B) B) 3.5 Ian D) 2.01m climbs the steepest part of the hill 3.01m C) from the railroad tracks shown on the map? to point P? Questions 23 through 27 refer to the following: The diagram below represents a contour map below. Letters A through K represent locations in the area. Hachute 1}i12 1 FOREST ,ooo RIDG 1,100 (,100 1 ,ooo MOOSE 1 o ,043 2 1/2 contour 1 interval 3000 1 CREEK ,ooo g km = 20 meters show depression hature lines 23) Which 24) Toward which hilltop could have an elevation of 1,145 neters? direction does A) southeast 25) B) Which equation A) B) gradient = Moose Creek flow? northeast wou'\d be used to determine the stream gradient along 0.8 km D) northwest gradient = 1.8 Ian 80 960m) x 20 m southwest Moose Creek between points J and K? C) 60 m gradient = (1,040 m- C) D) gradient — m x 100 80m 1.8 km 5 26) Which graph best represents the map profile along a straight line from point C through point A to point K? 1,100 1,100 1,000 1 ,ooo A) 900 900 Location Location 1,100 1,100 1,000 1 poo 900 900 Location 27) What is Location the lowest possible elevation of point A) 981m B) 961 B? m C) 971m D) 941m D) 140m Questions 28 through 32 refer to the following: The diagram below represents a contour map. Points A through F represent locations on the map. 100 .1/91'* i:ii 100 Meters Contour SCALE 28) What is the most likely elevation of the surface of Sunfish Lake? A) 151m 29) B) Which statenrnt about hill C is 28m best supported C) C is located apprmdnutely 2 lanwest ofthe Cedar River. C has been shaped by glaciers. Hill B) Hill C) The highest possible elevation of hill Cis 179 m. The steepest slope of hill Cis on the westem side. If no elevation values were given, which general rule could be used to establish that Cedar River flows into Sunfish Lake? A) Contour lines bend upstream when crossing a river. B) Rivers always flow toward large bodies of water. C) A large body of water is generally the source of water for a river. D) Rivers shmvn on maps generally flow southward. 31) Which 55m by the n-np? A) D) 30) (km) location has the same elevation as location D? Which diagram best represents the topographic profile from location A to 32)å 33) location F? VI 20 c 120 70 0 70 VI 20 Z120 70 70 A streamin New York State begins at a location 350 ITEters above sea level and flows into a swamp 225 neters above sea level. The length of the stream is 25 kilometers. A) 17 m/krn What is B) the gradient of the stream? 12 rn/km D) 9 m/km Questions 34 through 38 refer to the following: Points A through D represent locations in the region. 740211W 74015'W 420191 N 42015 N Dade Road 2 0 6 km 4 KEY: SWAMP SCALE Contour 34) What is N B) What is B) A) flow in 38) B) Compared to B) A) Mill River, 74022' C) C) 100 C) have fewer tibutaries D) drain a smaller region D) 42016' 351m 362m D) 301 m 300m m D) 500 m Fem River appears D) 10.01m C to point D? to the opposite direction the approximate distance between point A and point B ITEasured along 5.0 Ian B) w C) elevation of flow toward the sane lake What is W the approxim9te change in elevation from point A) 280m 37) 74015' The top of Fem Mountain could have an A) 500m 36) = 20 meters the approdmate latitude of point B? A) 42019' 35) interval 8.0 Ian C) Fem Road? 9.01an N Questions 39 through 42 refer to the following: Letters A K are reference points on the contour map below. through 740351 W 74030'W 42020' N 42020' N Hachure lines show—zom depression contours Contour o interval 2 1 Scafe in •awe = 10 meters 3 4 kilometers Jay Peak 183 Piper Mt. 42015tN 74 30jW 42015' 74 35JW 39) Which points are located at the A) land K 40) In B) which direction is level? C) Hand E D) AandF C) northeast D) southwest D) A and I D) 42019' CandB Green River flowing? A) southeast 41) same elevation above sea B) northwest The diagram below represents a topographic profile between two 210 200 points on the map. TOPOGRAPHIC PROFILE 190 @180 VI 70 x River .2160 > 150 140 130 120 110 Horizontal Distance Which two A) 42) locations are represented on the diagram by K and C What is the latitude A) 42019' B) X and Y, respectively? Band H C) Hand E C) 42020' and longitude of location B? N 74034' W B) 42020' N 74034' W N 74033' W N 74033' W
