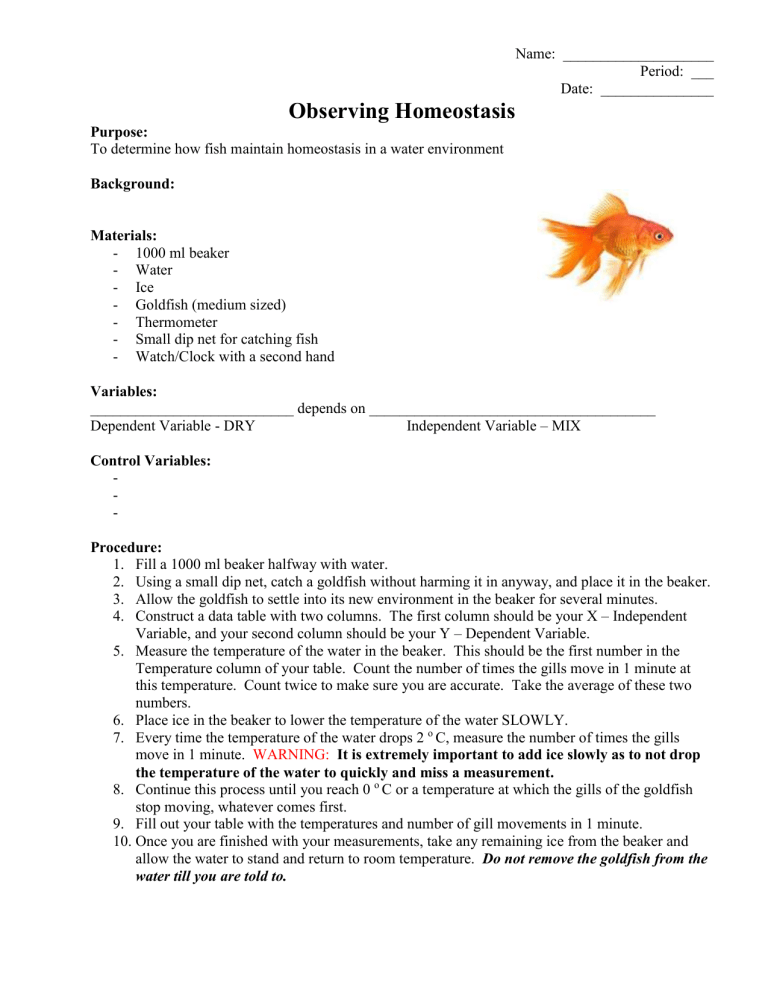
Name: ____________________ Period: ___ Date: _______________ Observing Homeostasis Purpose: To determine how fish maintain homeostasis in a water environment Background: Materials: - 1000 ml beaker - Water - Ice - Goldfish (medium sized) - Thermometer - Small dip net for catching fish - Watch/Clock with a second hand Variables: ___________________________ depends on ______________________________________ Dependent Variable - DRY Independent Variable – MIX Control Variables: Procedure: 1. Fill a 1000 ml beaker halfway with water. 2. Using a small dip net, catch a goldfish without harming it in anyway, and place it in the beaker. 3. Allow the goldfish to settle into its new environment in the beaker for several minutes. 4. Construct a data table with two columns. The first column should be your X – Independent Variable, and your second column should be your Y – Dependent Variable. 5. Measure the temperature of the water in the beaker. This should be the first number in the Temperature column of your table. Count the number of times the gills move in 1 minute at this temperature. Count twice to make sure you are accurate. Take the average of these two numbers. 6. Place ice in the beaker to lower the temperature of the water SLOWLY. 7. Every time the temperature of the water drops 2 o C, measure the number of times the gills move in 1 minute. WARNING: It is extremely important to add ice slowly as to not drop the temperature of the water to quickly and miss a measurement. 8. Continue this process until you reach 0 o C or a temperature at which the gills of the goldfish stop moving, whatever comes first. 9. Fill out your table with the temperatures and number of gill movements in 1 minute. 10. Once you are finished with your measurements, take any remaining ice from the beaker and allow the water to stand and return to room temperature. Do not remove the goldfish from the water till you are told to. Data and Observations Results: Using your data table, construct a graph of your results. Be sure to be neat and label everything accurately. Your graph should show a decrease in the number of gill movements with a decrease in temperature of the water. * Don’t forget a caption explain your results. What happened? Conclusions: Analysis/Discussion 1) What is the definition of homeostasis? 2) What happens to the rate at which gills move when the temperature changes? 3) Name two (2) qualitative and two (2) quantitative data measurements made during the lab. 4) Why does a fish move its gills less in cold water than in warm water? 5) What is the overall function of gills in a fish? 6) How do gills help fish maintain homeostasis?
