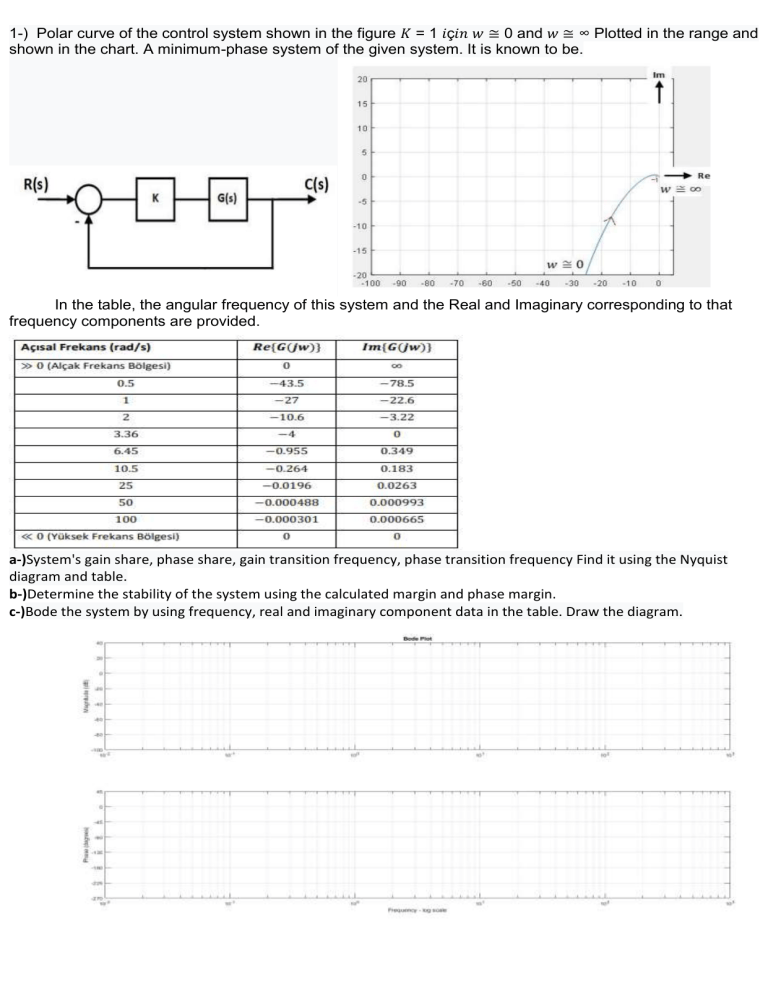
1-) Polar curve of the control system shown in the figure 𝐾 = 1 𝑖ç𝑖𝑛 𝑤 ≅ 0 and 𝑤 ≅ ∞ Plotted in the range and shown in the chart. A minimum-phase system of the given system. It is known to be. In the table, the angular frequency of this system and the Real and Imaginary corresponding to that frequency components are provided. a-)System's gain share, phase share, gain transition frequency, phase transition frequency Find it using the Nyquist diagram and table. b-)Determine the stability of the system using the calculated margin and phase margin. c-)Bode the system by using frequency, real and imaginary component data in the table. Draw the diagram.
